AI · Automation — April 28, 2026
AR Operations Today
Satisfied But Stuck–And Ready for Agents
Accounts receivable (AR) is still running on a patchwork of spreadsheets, rigid ERP modules, and first-generation automation tools. A proprietary survey of 430 AR leaders conducted by Activant Capital1 reveals a market that is simultaneously satisfied and stuck, and one where AI agents, priced as digital labor rather than software subscriptions, are poised to redraw the competitive map. Four findings stand out:
- Friction is systemic, not localized. Pain is spread almost evenly across payment processing, collections, cash application, reconciliation, and disputes, concentrating around exceptions. 46% of AR leaders cite high exception volumes and repetitive manual work as the biggest drivers of inefficiency, squarely in the sweet spot for AI agents.
- Satisfaction is a mirage. 84% of respondents rate their current AR tool a 4 or 5 out of 5, but only 32% stay because the product works well. The other 68% are held back by budget constraints, deep ERP integrations, switching costs, and vendor lock-in.
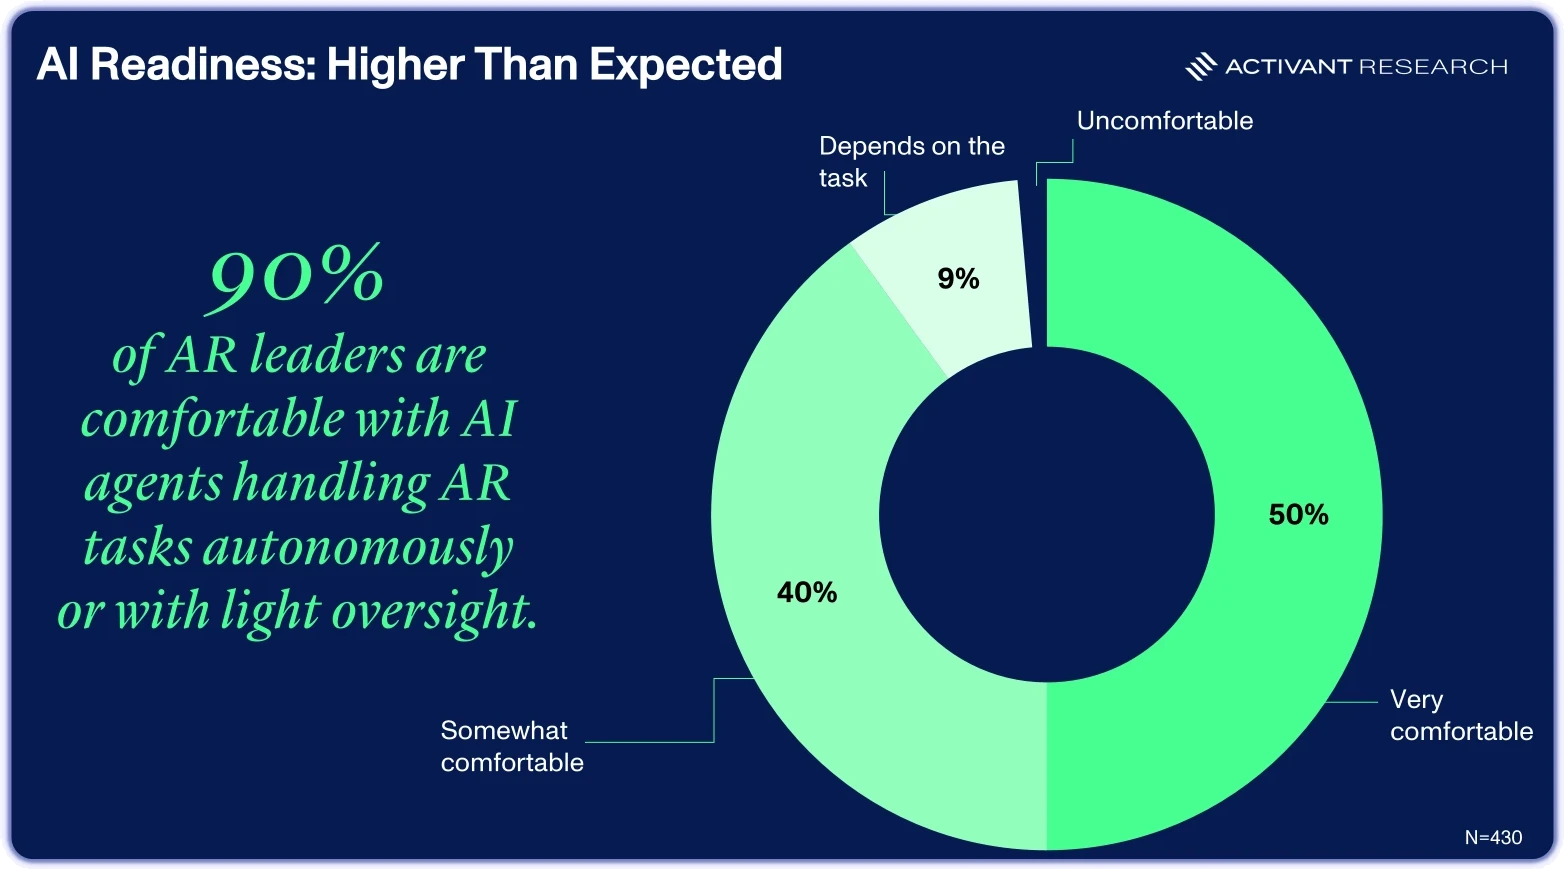
- AI readiness is already here. 90% of AR leaders are comfortable letting AI agents handle tasks autonomously or with light oversight; only 1% are uncomfortable. For a historically conservative and audit-sensitive function, that is a remarkable shift.
- Speed beats price as the switching trigger. 54% say faster implementation and time to value would make them seriously consider a new tool, outranking cost by 17 percentage points. Legacy platforms that take six to eighteen months to go live are structurally exposed.
The most consequential finding, though, is how buyers want to pay. They have stopped benchmarking AI agents against software budgets and started benchmarking them against payroll. 96% find per-agent pricing appealing, and per-seat licensing ranked last in every revenue tier. That reframe matters well beyond AR: when software is priced as labor rather than seats, the ceiling on enterprise spend moves from the IT budget to the payroll line, and the addressable market expands accordingly.
The challengers that can deploy quickly, handle messy exception work, and price their agents as digital hires are positioned to capture a disproportionate share of the next generation of the order-to-cash stack.
A Team Stretched Thin, and Tooling to Match
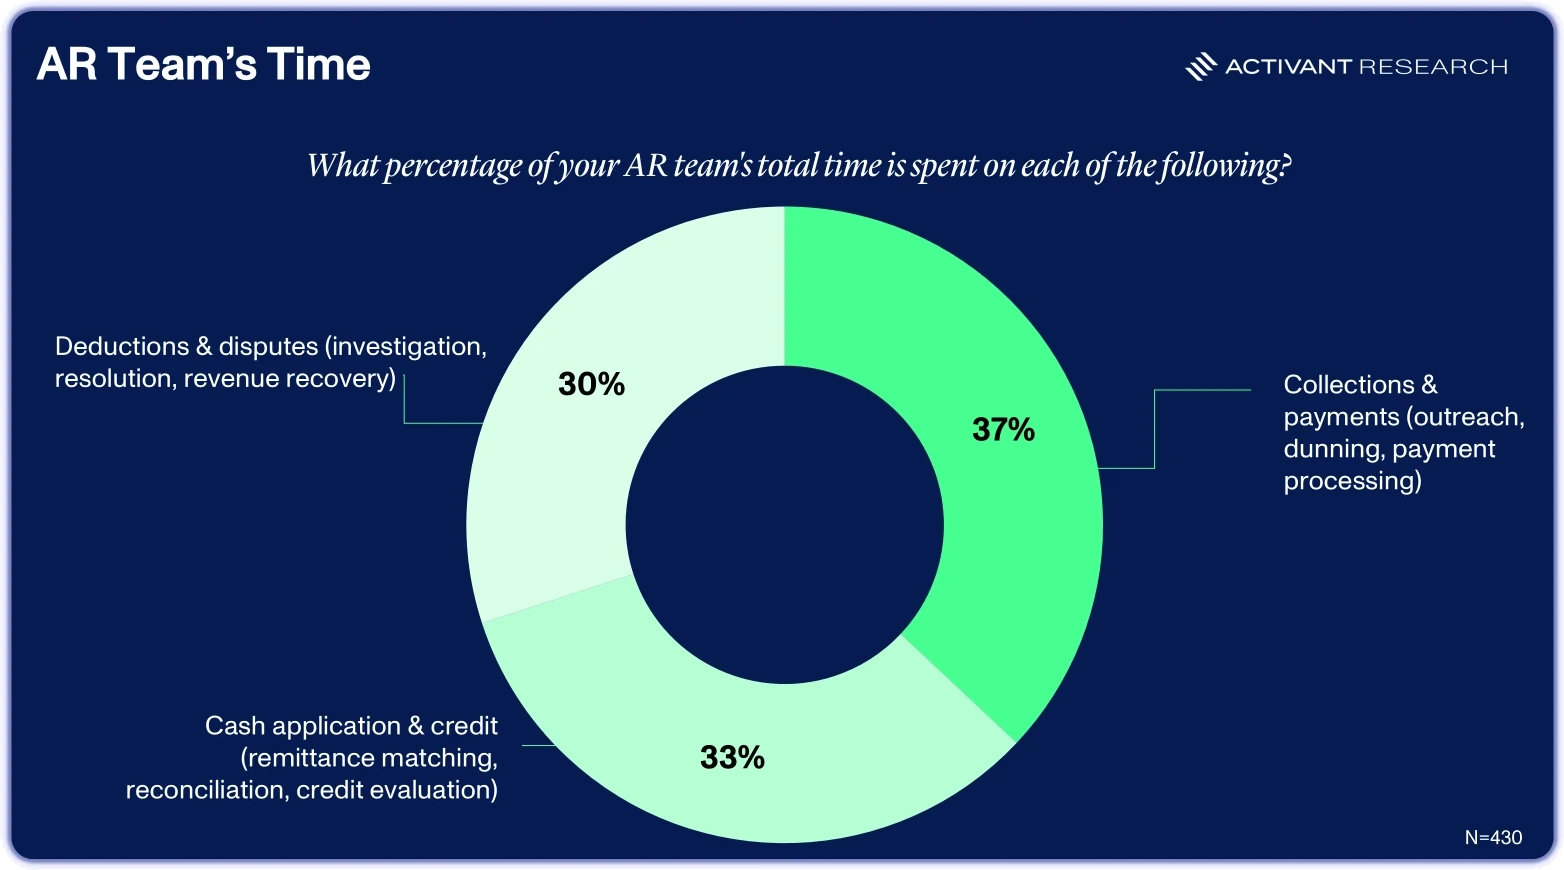
AR teams are stretched thin across the board, and the data shows it. Time is split almost evenly across three major workstreams: collections and payments (37%), cash application and credit (33%), and deductions and disputes (30%). No single activity dominates, so no single automation unlocks meaningful time savings.
Meanwhile, 42% of small organizations (51 – 200 employees) are running AR with 10 or fewer people, many of them processing 500 to 2,000 invoices a month. Even at $1B+ companies, 48% still rely on spreadsheets alongside specialist tools, and most firms layer multiple solutions rather than consolidating. The tooling is fragmented, the work is fragmented, and the teams are undersized for the volume they’re handling.
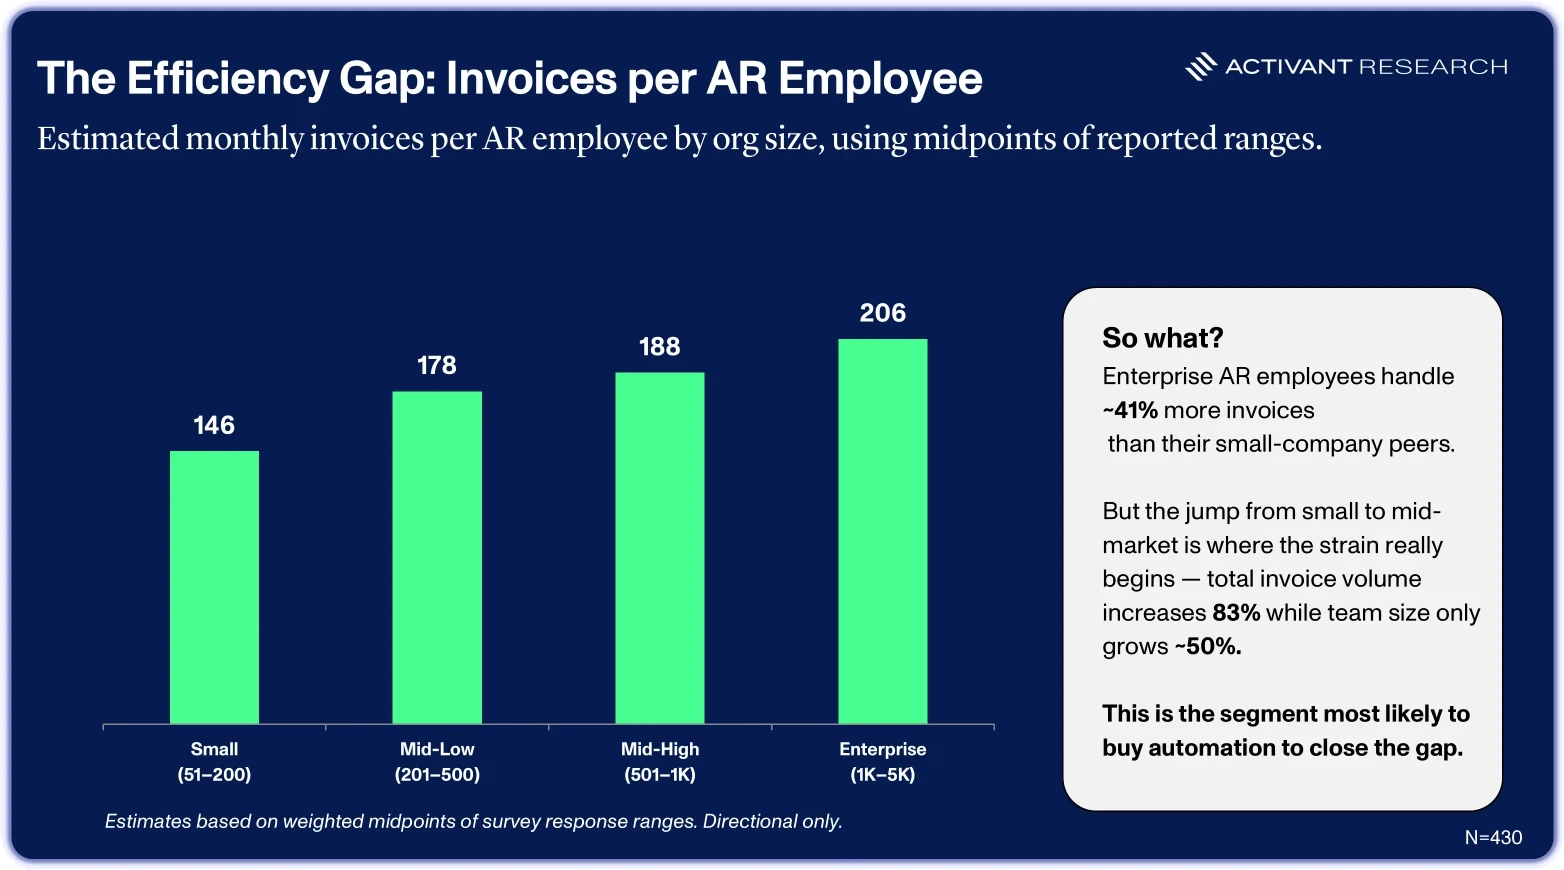
The crunch is worst in the mid-market. As companies grow from small (51-200 employees) to mid-market (201-500 employees), invoice volume jumps roughly 83%, but AR headcount only grows about 50%. Workload rises steadily per person: from around 146 invoices per AR employee per month at small firms, climbing to 206 at enterprise scale (1-5K employees). By then, each AR employee is handling about 41% more invoices than their counterpart at a smaller company. The mid-market sits at the inflection point where manual processes begin to crack under volume pressure and the ROI case for automation is most acute.
Friction at Every Step
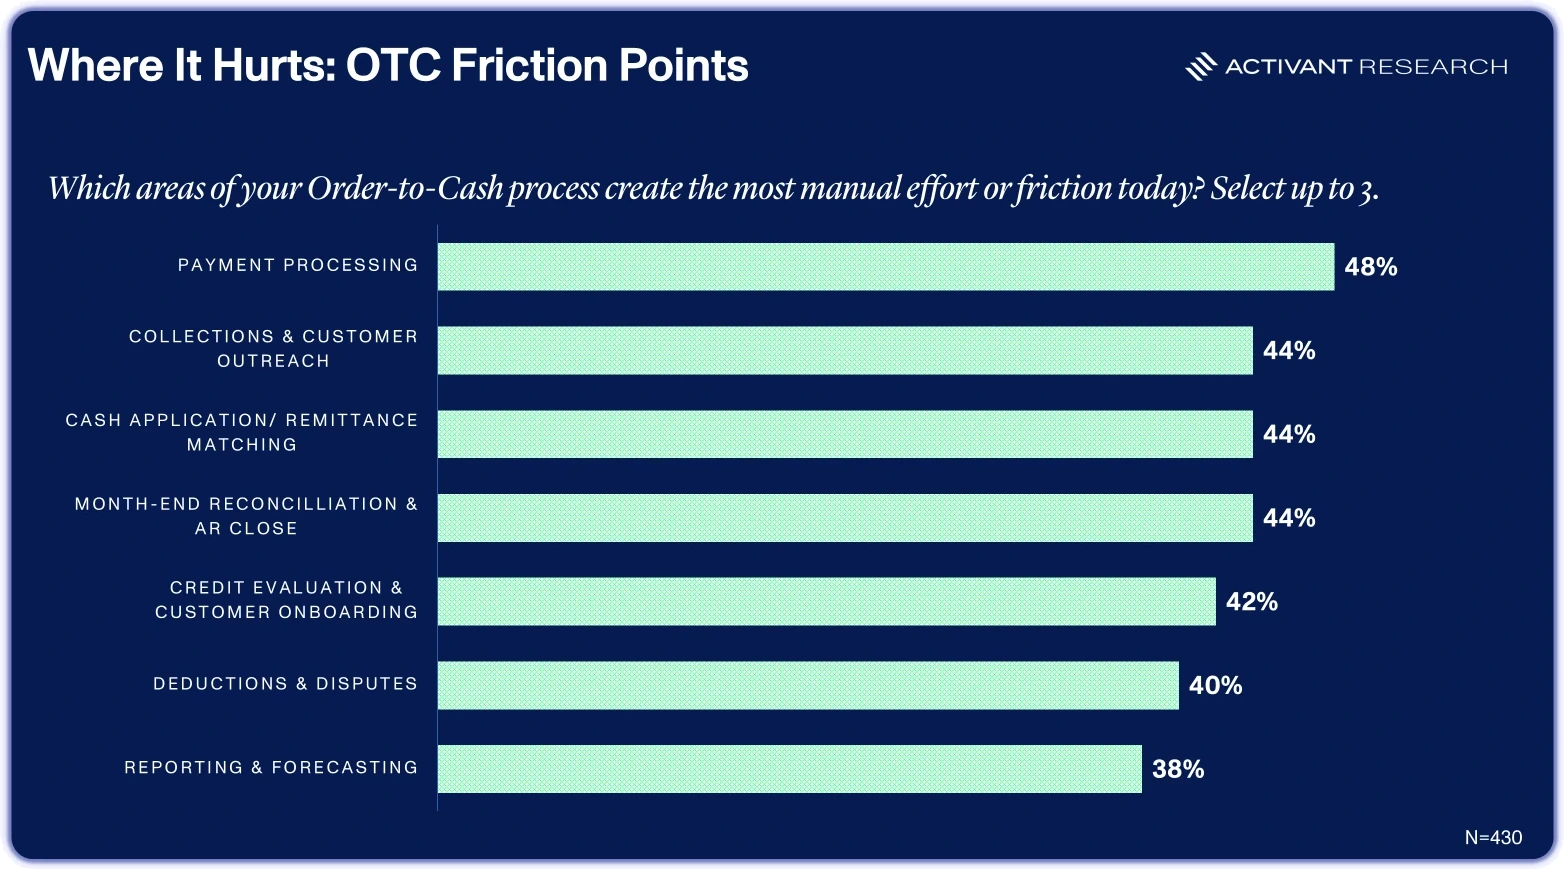
The problem isn’t just that there’s more work. It’s that the work is scattered. When asked to identify the areas of their order-to-cash process that generate the most manual effort and friction, payment processing topped the list at 48% followed by a three-way tie at 44% across collections and customer outreach, cash application and remittance matching, and month-end reconciliation. Deductions and disputes follow closely at 40%, with reporting and forecasting at 38%. The tight spread tells us that friction is systemic, not localized. AR teams are not fixing one broken process; they are managing a portfolio of partially automated workflows, each demanding human intervention at the edges.
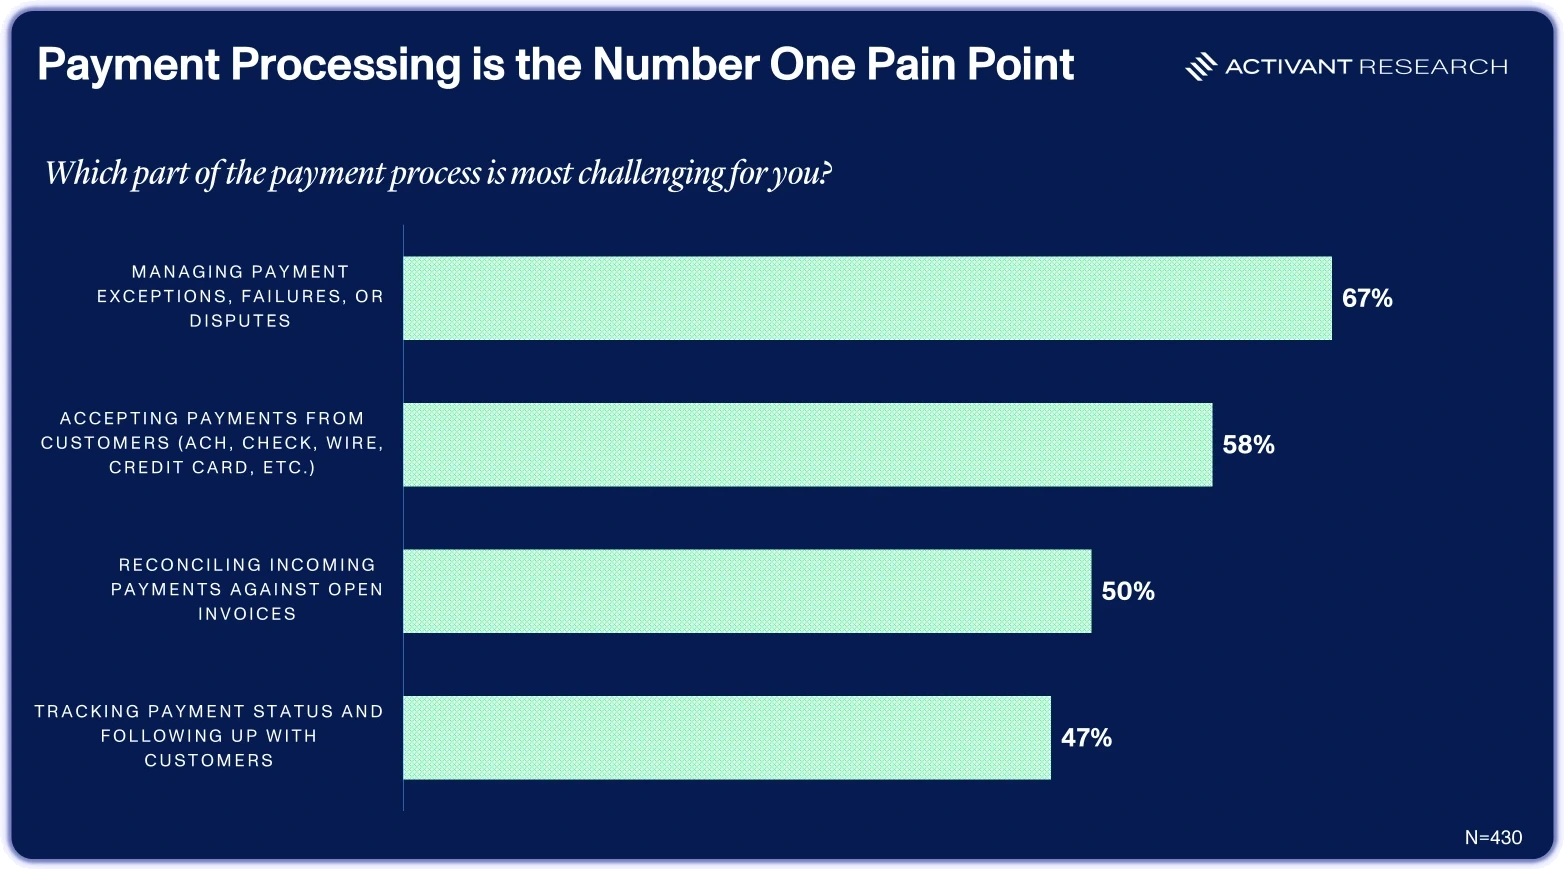
Zoom in on any one of those workflows and the same pattern emerges: the pain concentrates around exceptions. Within payment processing, 67% of respondents who flagged it as a top friction area cite managing exceptions, failures, or disputes as the hardest part. Accepting payments across multiple formats (ACH, check, wire, credit card) followed at 58%, with reconciling incoming payments against open invoices at 50%.
Exceptions are the Tax on Every Workflow
Across AR, exceptions dominate. When asked to name the single biggest driver of inefficiency in their operations, AR leaders pointed to high exception volumes that require human judgment (25%), and excessive manual, repetitive work (21%). Together those two factors account for 46% of responses, and both sit squarely in the sweet spot for AI agent automation.
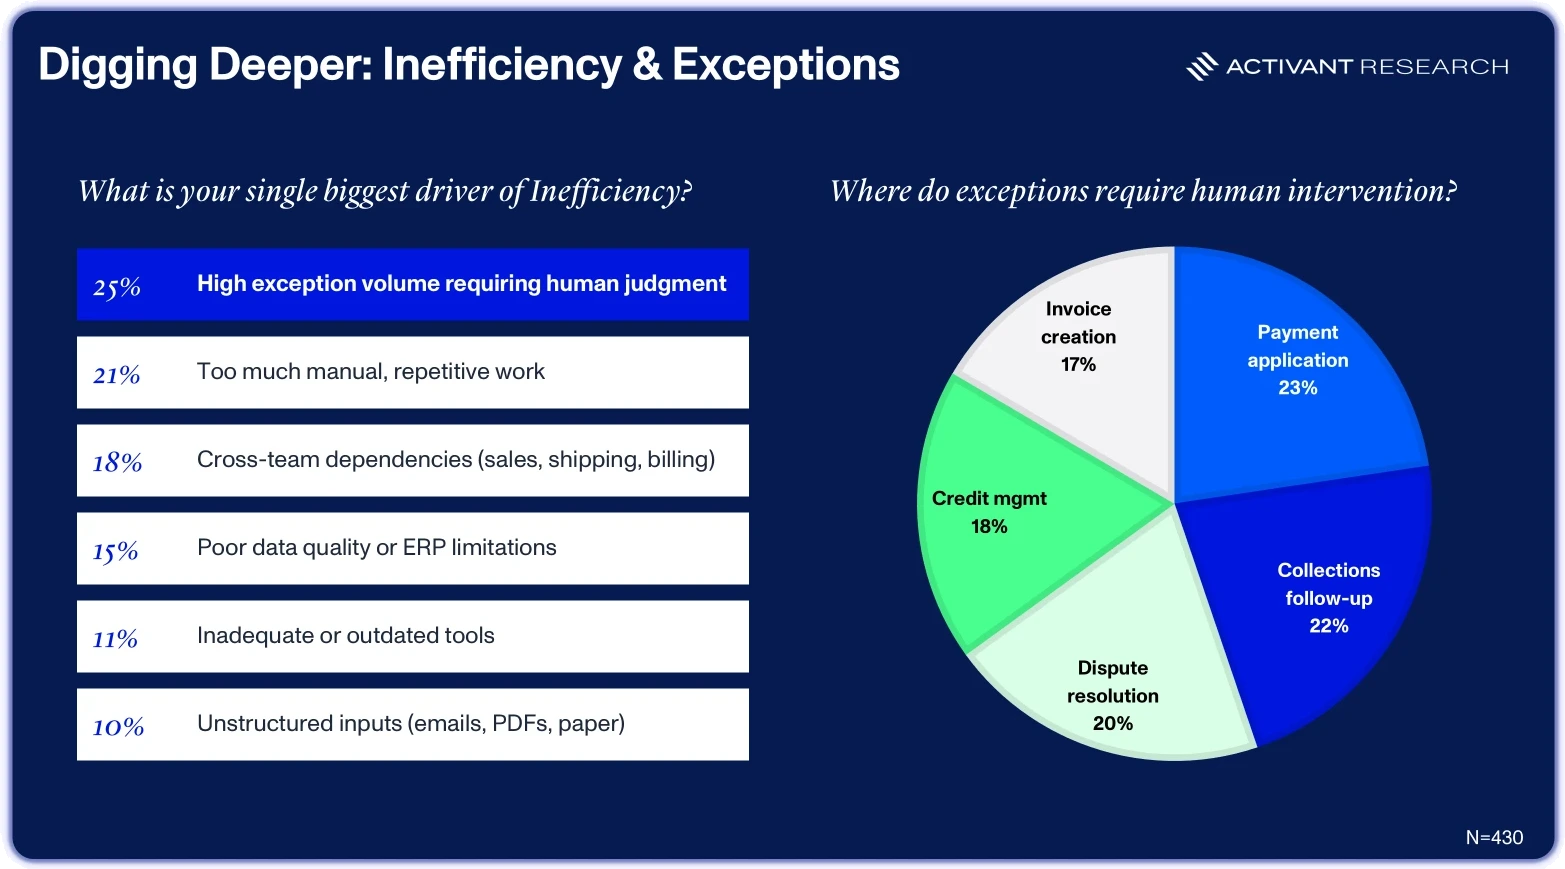
The rest reinforces the same picture: cross-team dependencies (18%), poor data quality (15%), inadequate tools (11%), and unstructured inputs (10%) make up the remaining drivers of inefficiency, creating fragile processes at every handoff point. Exceptions requiring human intervention are evenly spread across the O2C (Order to Cash) cycle: payment application (23%), collections follow-up (22%), dispute resolution (20%), credit management (18%), and invoice creation (17%). That near-uniform distribution suggests that exceptions are a structural feature of the entire workflow, not a problem confined to one team or function.
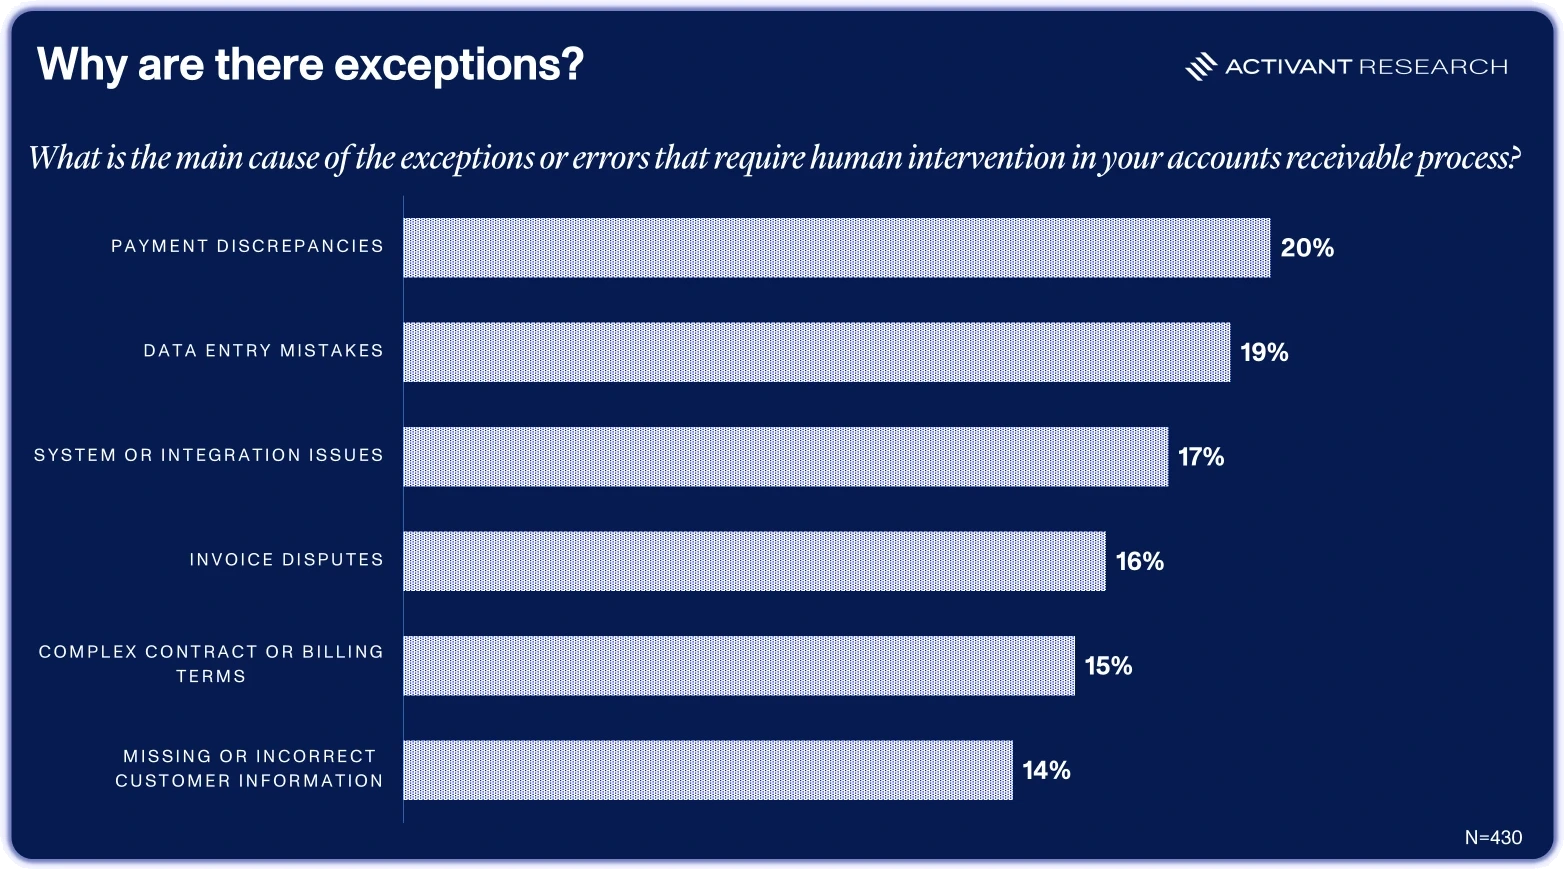
Root causes are equally diffuse: payment discrepancies (20%), data entry mistakes (19%), system or integration issues (17%), invoice disputes (16%), complex contract or billing terms (15%), and missing or incorrect customer information (14%). No single root cause accounts for more than a fifth of the problem.
This equal distribution makes single-purpose tools ineffective. If you fix one category, you’ve only knocked out a fraction of the problem. This also explains why so many teams default to spreadsheets and manual chasing: when issues come from six different directions, it’s tough to build a business case around fixing just one. For vendors, the takeaway is straightforward. The winners will be tools that can triage across multiple failure types, not just automate one slice. The distribution pattern favors broad, horizontal automation over narrow point solutions.
The Frustration Runs Top to Bottom
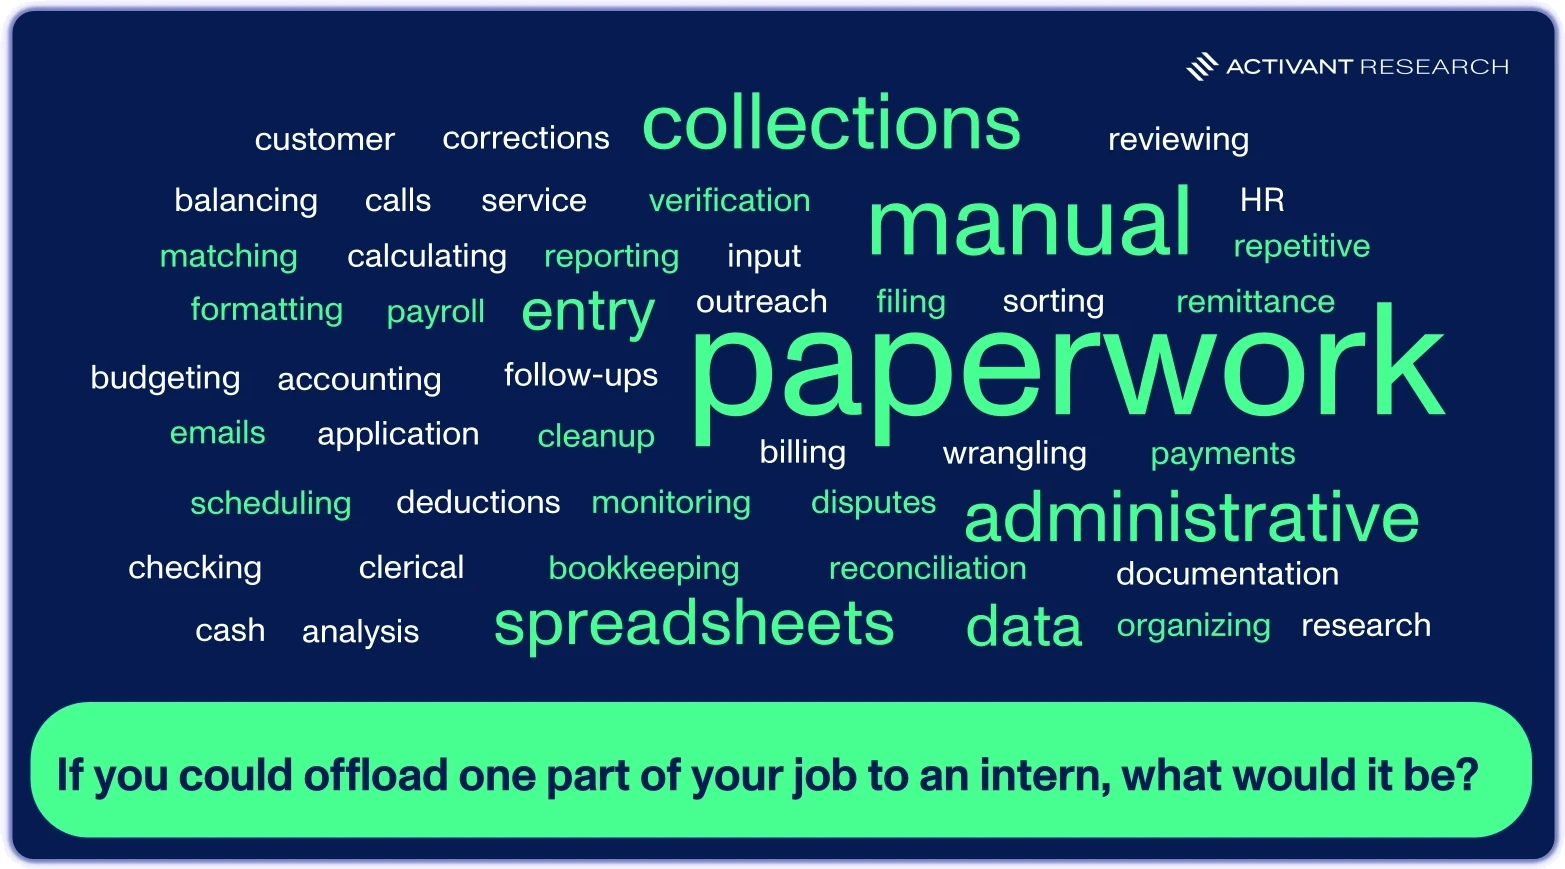
Sentiment data reinforces the numbers: AR professionals are deeply frustrated with the status quo. Asked what they would offload to an intern, the most common answers were “paperwork,” “manual,” “data entry,” and “collections,” all low-judgment, repetitive tasks that sit well below their skill level.
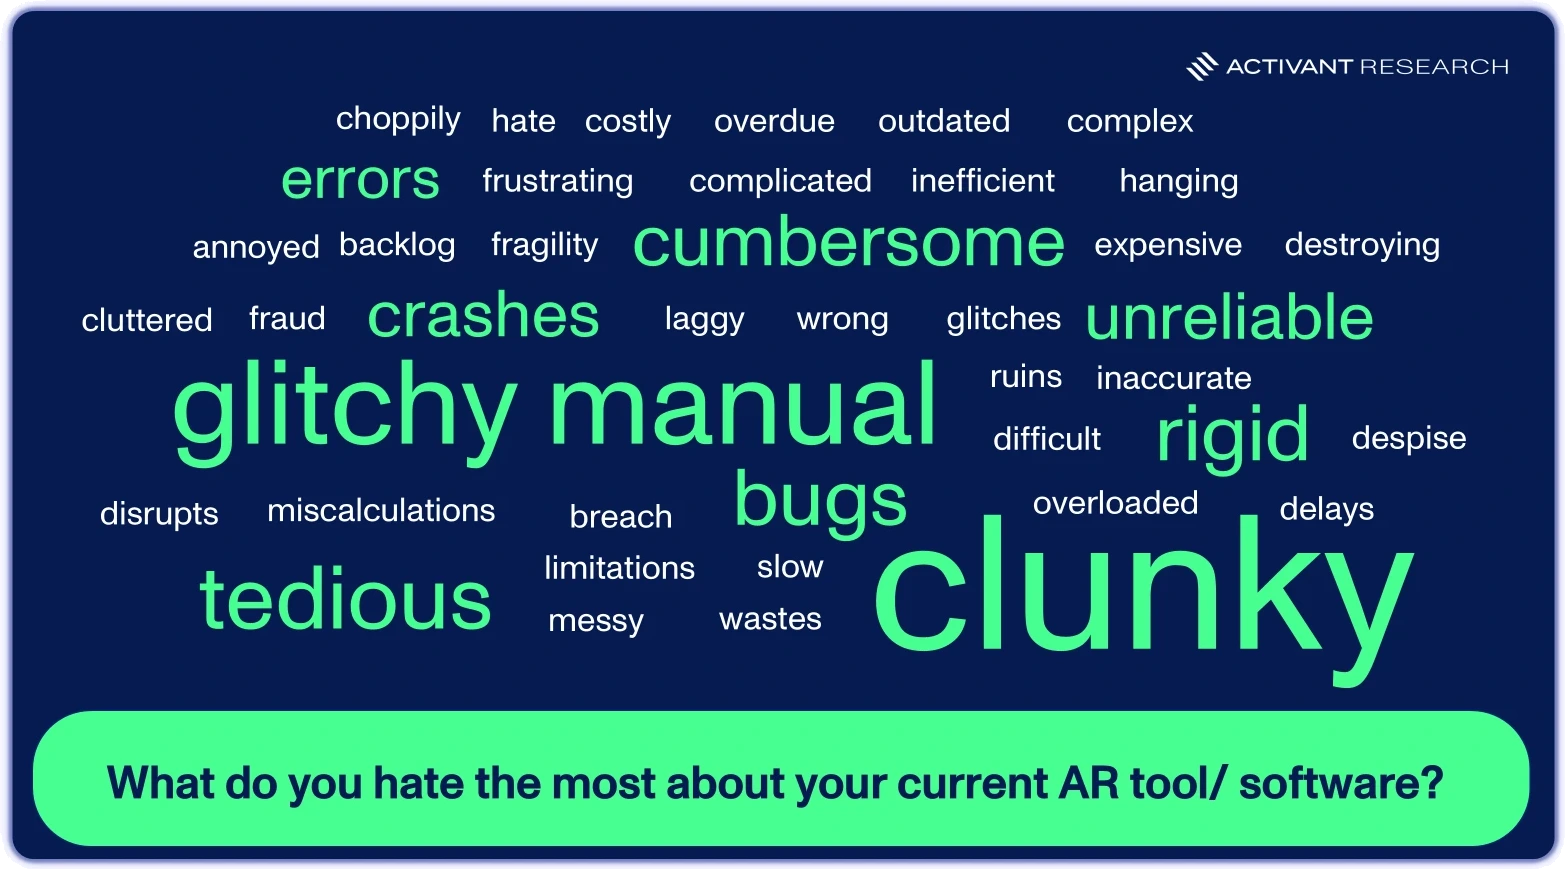
And when asked what they hate about their current tools, the responses were even more blunt: “clunky,” “glitchy,” “tedious,” “rigid,” and “manual” dominate, with words like “hate,” “despise,” and “destroying” reflecting genuine emotional fatigue.
Frustration with AR inefficiency isn’t just a top-down concern from finance leaders staring at cost metrics. The people doing the work feel it just as acutely, often more so, and that alignment changes the usual story about enterprise AI adoption. For years, the narrative centered on resistance: fear of job loss, distrust of automation, skepticism about whether the technology could handle real work. But when the people closest to the problem are also the ones most exhausted by it, the barrier to AI adoption isn’t resistance but execution.

“Stuut has absorbed the part of AR that drains a finance team the fastest. The outreach, the invoice follow-ups, the back-and-forth of parsing whatever a customer sends back. It used to eat most of our week and produce very little. Now it just runs, and we spend our time on the accounts where we can actually move the number.”
Stuck, Not Sold
Given that level of readiness and frustration, you’d expect buyers to be actively evaluating and switching tools. At first glance, the numbers look reassuring for incumbents: 84% of respondents rate their current AR tool a four or five out of five for satisfaction. Dig one layer deeper, though, and the picture inverts. Only 32% stay because the product works well enough on its own merits. The remaining 68% cited structural barriers: budget constraints (19%), deep ERP integration they cannot easily unwind (19%), switching costs and implementation risk (17%), and contractual or vendor lock-in (10%). A mere 3% said they stay because no better or cheaper alternative exists.
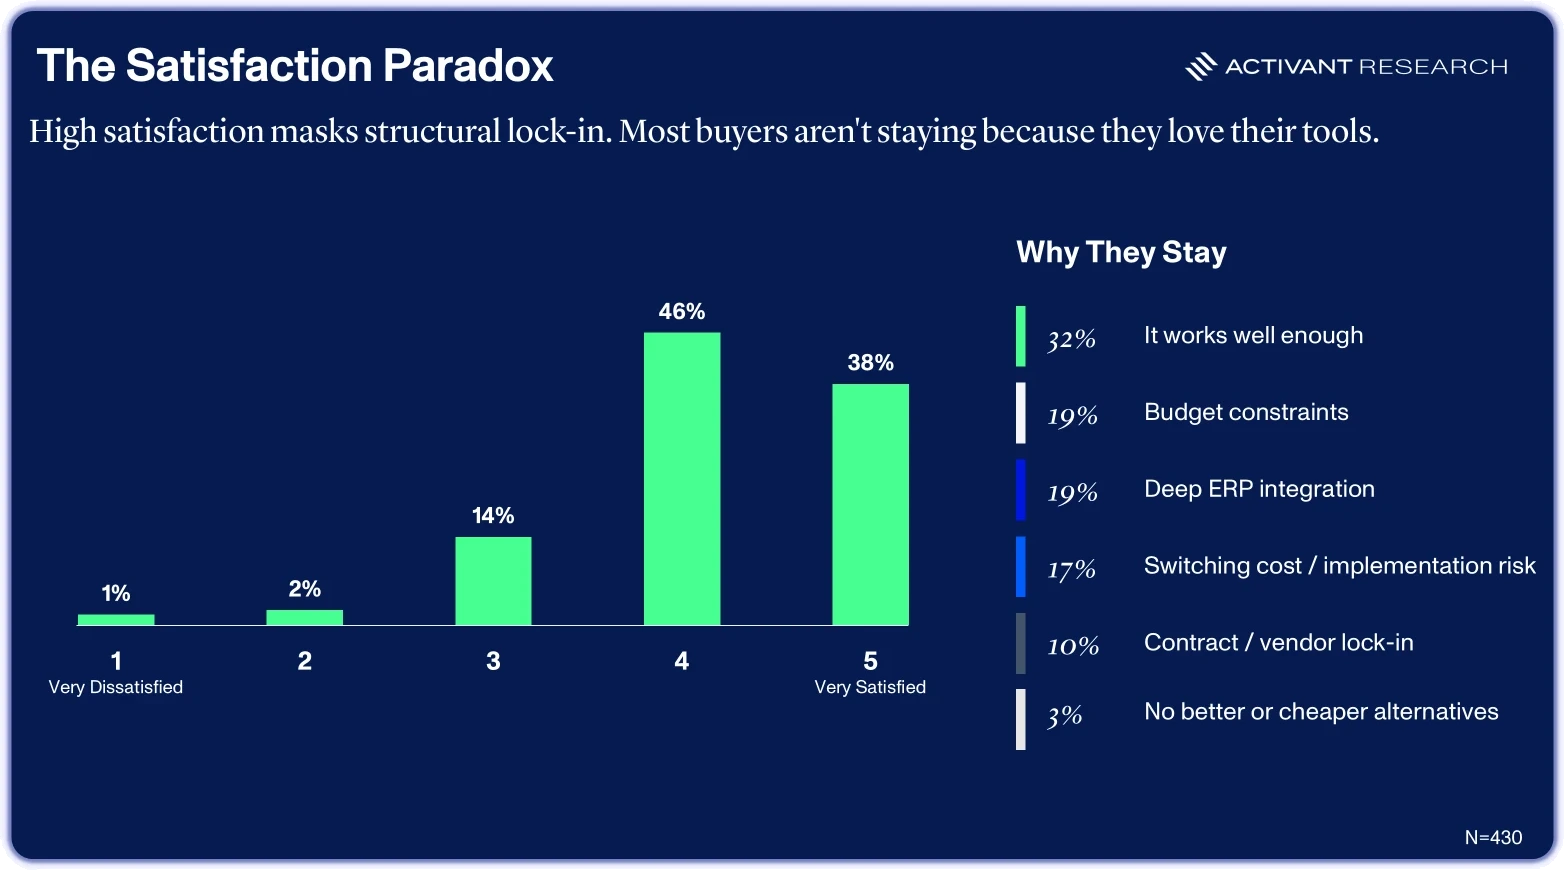
This is a market of captive, not contented, customers. High satisfaction scores mask a buyer base that would move if someone lowered the friction of switching. That distinction matters enormously for how we think about competitive dynamics, go-to-market strategy, and where venture capital should flow in the order-to-cash stack.
AI Readiness is Already Here
Perhaps the most interesting finding in the survey is the degree to which AR leaders have already crossed the psychological threshold on AI. 90% of respondents said they are comfortable with AI agents handling AR tasks autonomously or with light oversight: 50% are very comfortable, 40% somewhat comfortable, 9% said it depends on the task, and only 1% expressed discomfort outright.
For a function that is historically conservative, audit-sensitive, and skeptical of black-box automation, that’s a remarkable shift. AR teams are already cognitively prepared for AI to absorb the work they find most draining. The bottleneck is no longer buyer willingness.
But readiness is only half the equation. Knowing that AR teams are open to AI tells us the door is unlocked. It does not tell us what gets decision makers to walk through it. Comfort with the technology does not automatically translate into a purchase order, especially in a category where most teams already have something in place. So, we asked what it would take to move them. The answer turned out to be how quickly a new system can prove its worth.
What Breaks the Inertia: Speed, not Price
If the satisfaction paradox describes why the market appears stable, the switching trigger data reveals how that stability can unravel. We asked respondents what would make them seriously consider a new AR tool in the next six months. The number one answer, at 54%, was faster implementation and time to value. AI capabilities that actually work came second at 51%. Better handling of deductions and disputes placed third at 49%. Measurably faster collections (lower DSO) followed at 44%. Meaningfully lower total cost and significant reduction in AR headcount or labor costs tied for last at 37% each.
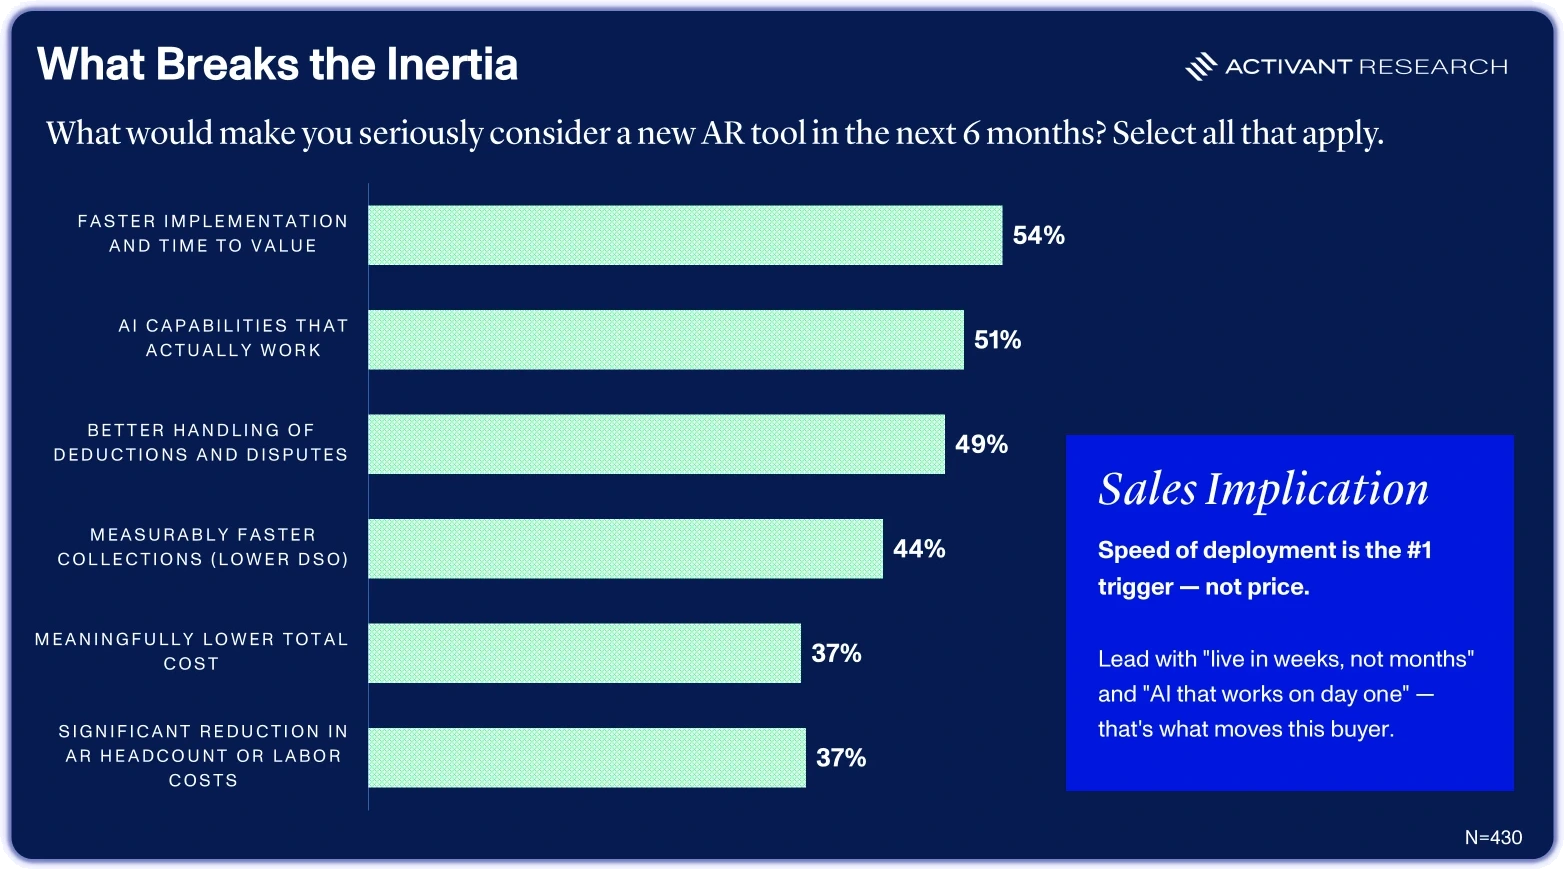
The hierarchy is instructive. Speed outranks price by 17 percentage points. This implication is clear: lead with deployment speed and demonstrable AI performance, not discounts. Legacy order-to-cash platforms that require six to eighteen months of implementation and configuration work are structurally disadvantaged against any challenger that can go live in weeks.
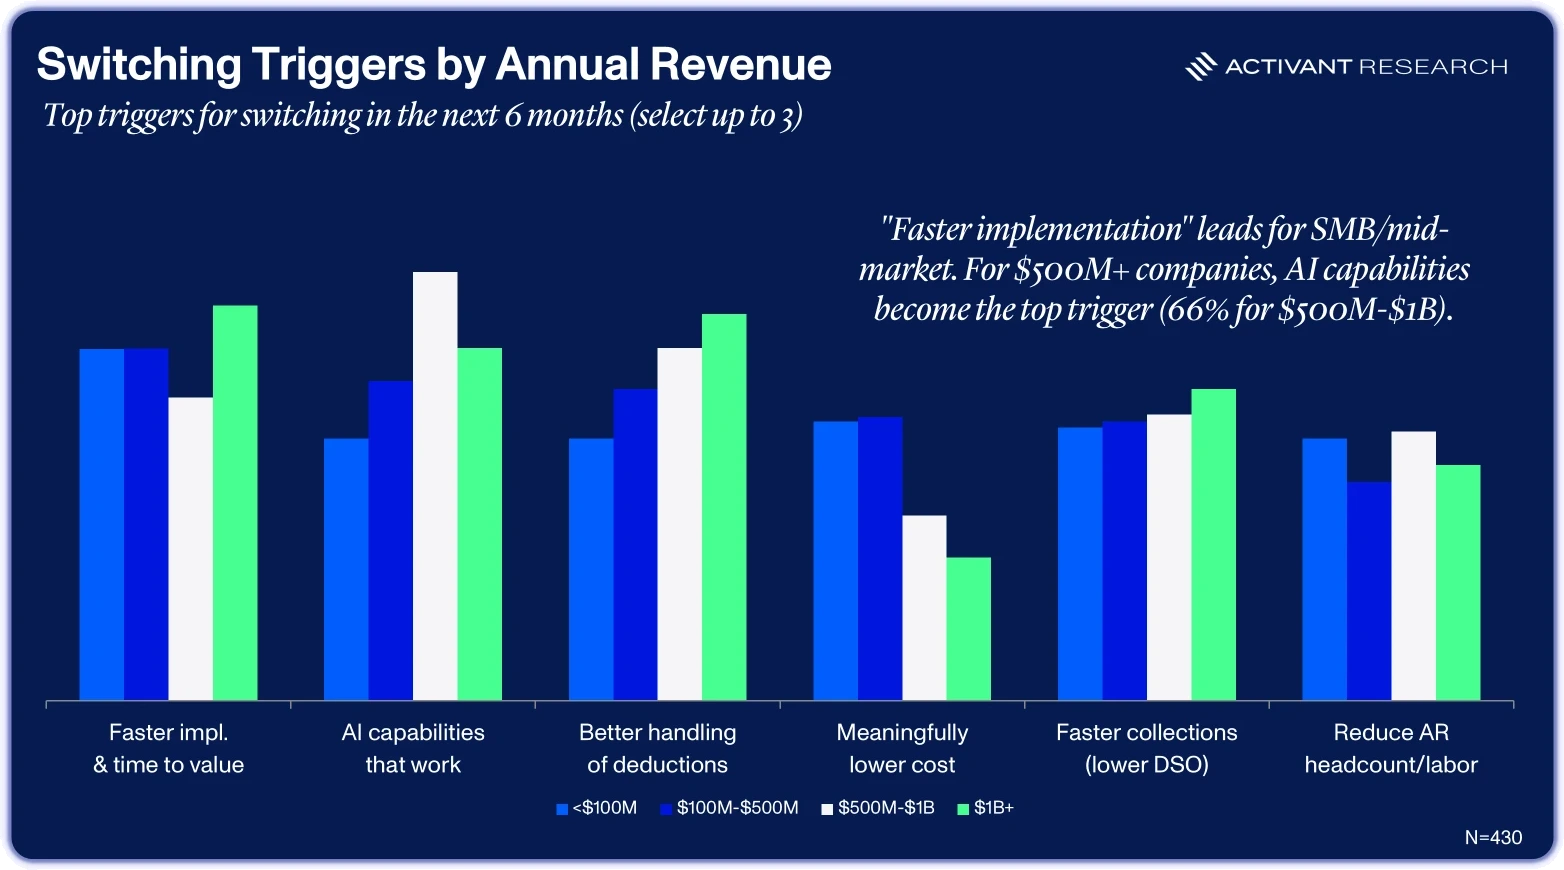
The segment-level data adds further texture. Faster implementation is the top or near-top trigger across every revenue tier, peaking at 61% for companies above $1 billion. AI capabilities as a switching trigger scale dramatically with company size: from 40% among sub-$100 million firms to 66% among companies in the $500 million to $1 billion range. As expected, cost sensitivity moves in the opposite direction: “meaningfully lower total cost” drops from 43% at the smallest companies to just 22% at the largest. Larger firms care less about cost and more about capability.
That pattern of priorities shifting with scale resurfaces when we question AR leaders about their objectives.
Priorities Shift by Scale – But Headcount Reduction Remains Last
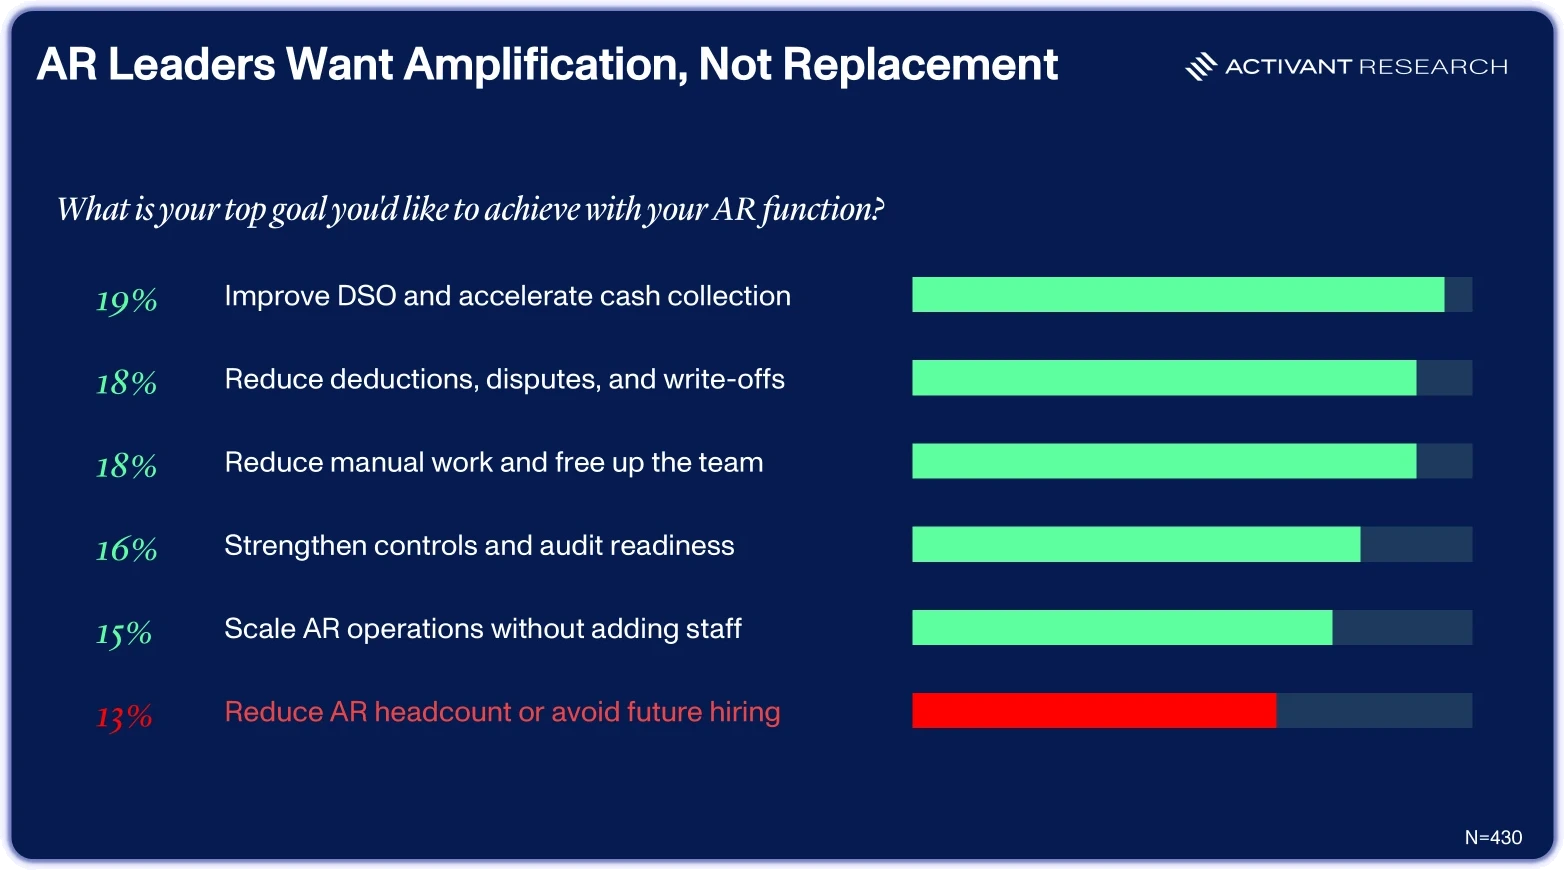
We asked respondents to rank their top AR priorities, and the aggregate results came back tightly clustered. Improving DSO and accelerating cash collection led at 19%, followed by reducing deductions, disputes, and write-offs and reducing manual work (both 18%), strengthening controls and audit readiness (16%), scaling AR operations without adding staff (15%), and reducing AR headcount or avoiding future hiring (13%).
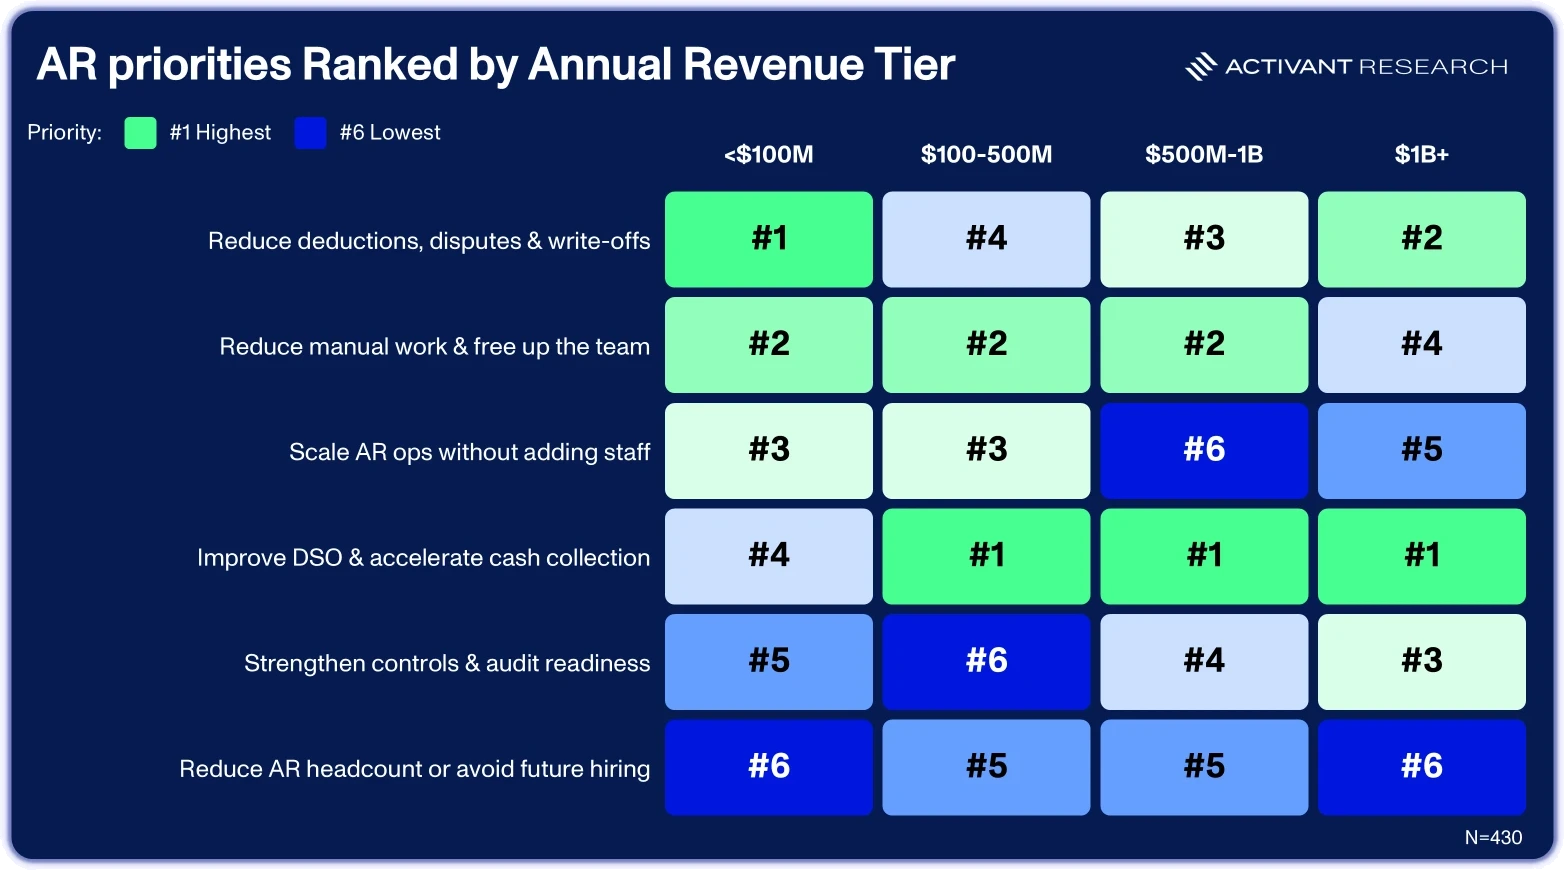
When we break the priorities down by revenue tier, the point becomes even clearer. Reducing AR headcount or avoiding future hires is, without exception, the lowest or second-lowest priority for AR leaders regardless of company size. The priorities that do lead shift with scale: smaller companies rank reducing deductions and write-offs first, while the mid-market and up prioritize improving DSO and accelerating cash collection. But across every segment, the focus is on outcomes, not downsizing.
AR leaders aren’t buying automation to shrink their teams. They’re buying it to amplify what their existing teams can accomplish: faster cash collection, fewer write-offs, more capacity per person. The ROI framing that resonates with this buyer is speed and throughput, not labor elimination, and any vendor pitching headcount reduction as the headline value proposition is misreading its audience.
But while AR leaders don’t want to replace people, the instinct to think about AR work in terms of people rather than software shows up again in how they want to pay for it.
Buyers Want to Hire Agents, Not License Seats
This is where the survey produced what we believe is its most important finding, not just for AR but for the broader AI software market. We asked respondents to rank six pricing models for AI-powered AR automation, and the results were unequivocal. Per-agent pricing ranks first across all segments; per-seat licensing ranks last.
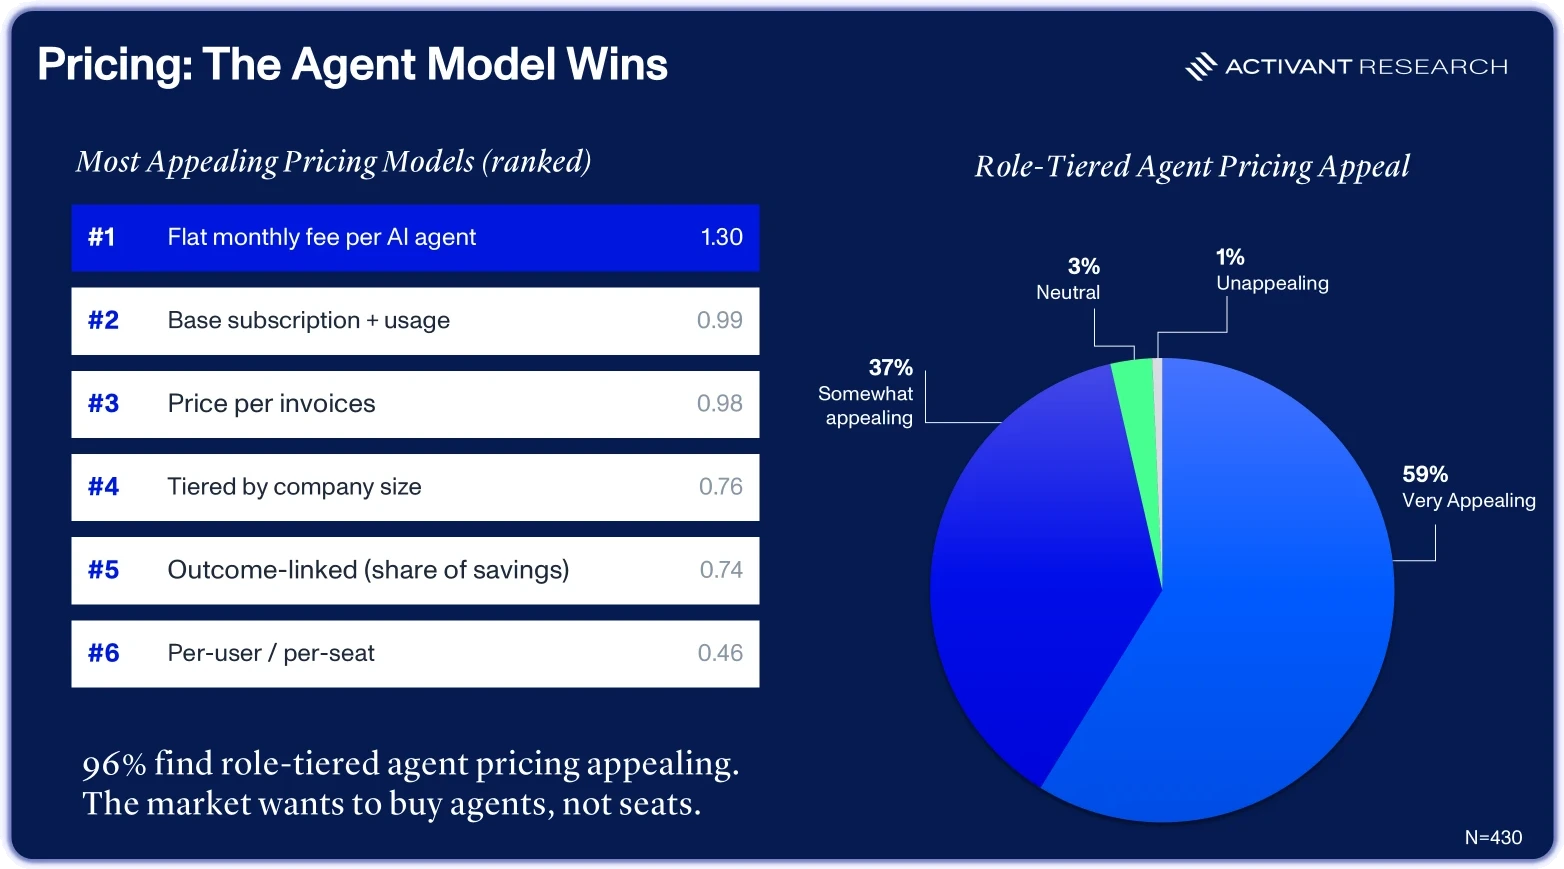
A flat monthly fee per AI agent ranked first with a composite score of 1.30, meaningfully ahead of the second-place model (base subscription plus usage, at 0.99) and third-placed per-invoice pricing (0.98). Tiered subscription by company size scored 0.76, outcome-linked pricing 0.74, and per-user or per-seat licensing came in dead last at 0.46.
The agent model won across every revenue tier. It scored 1.37 at sub-$100 million companies, 1.30 in the $100–500 million band, 1.32 between $500 million and $1 billion, and 1.17 at $1 billion-plus. Per-seat pricing finished last in every segment. Regardless of company size, industry, or invoice volume, buyers prefer to pay a flat fee for a defined unit of AI work capacity over any form of seat-based, transaction-based, or outcome-linked model.
We pushed the idea one step further by testing role-tiered agent pricing, where different AI agents are priced at different levels depending on the complexity and scope of the tasks they handle, analogous to how companies pay different salaries for different roles. Here, 96% of respondents found the concept appealing (59% very appealing, 37% somewhat appealing), while only 3% were neutral and 1% found it unappealing.
These results point to a mental model that has already shifted. Buyers aren’t benchmarking AI agents against software budgets. They’re benchmarking them against payroll. The framing has moved from “I’m purchasing a tool” to “I’m hiring a digital team member at a fraction of the cost of a human one.”

“This survey confirms what we hear every week: buyers have stopped thinking about AR tools and started thinking about AR capacity. They want to hire, not license. That's exactly how we built Stuut. Each agent is a digital coworker that owns collections, cash application, deductions, and disputes end to end, and plugs into your existing ERP in days. When you buy work instead of seats, the math changes completely.”
That shift matters well beyond AR. The historical ceiling for enterprise software spend was set by IT budgets. When software delivers autonomous labor, that ceiling dissolves and the addressable market expands to compete with the payroll line. The survey makes that concrete: buyers already think in labor terms, prefer flat per-agent pricing, and are willing to pay at price points anchored to a percentage of employee cost.
Market Implications
The barriers holding the AR market in place are no longer psychological or technical. They are structural. High satisfaction masks low loyalty. Buyers are ready for autonomous AI, but switching friction holds them back. Speed is the decisive trigger coupled with a decisive rejection of the per-seat model that has defined enterprise software for two decades. The implications look different depending on where you sit.
For incumbents, the message is uncomfortable. A customer base that scores you highly but stays only because switching is painful is not a loyal one, and because speed outranks price as the primary switching trigger, defending position on cost alone will not work. They will need to match challengers on deployment speed and AI capability, which is difficult to deliver inside architectures built around multi-year implementation cycles.
For challengers, the playbook is legible in the data. Build AI agents that handle the workflows where pain lives – payment exceptions, cash application, deduction resolution – with enough accuracy to earn trust from a finance audience that is already 90% willing to let AI operate autonomously. Deploy in weeks, not quarters, because the legacy six-to-eighteen-month implementation timeline is an exploitable weakness. And price as labor, not as software: flat per-agent fees, tiered by complexity, aligned with how buyers already think.
For buyers, the shift is in procurement framing. The useful comparison is no longer a feature matrix against the current platform. It is speed to live, demonstrated performance on exceptions, and total cost measured against the fully loaded cost of the AR headcount you would otherwise hire. The vendors worth serious evaluation are the ones that can get you live quickly and show measurable impact on DSO and deduction recovery in the first few weeks.
For investors, the structural themes are hard to miss. The AR automation market is large, sticky by default, and ripe for disruption by anyone who can reduce switching friction. Buyer readiness is also far higher than most market participants assume: 90% of AR leaders are comfortable handing their work to autonomous AI agents, a level that far outpaces the rest of finance, where the AICPA/CIMA Future-Ready Finance survey found just 8% of leaders feel their organization is “very well prepared” for AI.2 The demand signal is broadening, and the shift from per-seat to per-agent pricing is already the stated preference of 96% of buyers surveyed. When pricing is anchored to labor economics rather than software budgets, the addressable market expands dramatically.
What makes this moment unusual is that the reframe from software to labor is not vendor-driven; it’s buyer-led. That framing shows up consistently across company size, industry, and invoice volume.
The companies that build for it with agents priced as labor, deployed at the speed buyers demand, and capable of handling the messy exception-driven work that defines real AR operations, will capture disproportionate value in the next generation of the order-to-cash stack. Those that keep selling seats into a market that has stopped buying them will discover that high satisfaction scores are a poor substitute for genuine loyalty.
Footnotes
-
Activant Capital is an investor in Stuut Technologies, an accounts receivable automation platform operating in this space. ↩
-
AICPA & CIMA, Future-ready finance: Technology, Productivity, and Skills Survey Report, 2025 ↩
Disclaimer: The information contained herein is provided for informational purposes only and should not be construed as investment advice. The opinions, views, forecasts, performance, estimates, etc. expressed herein are subject to change without notice. Certain statements contained herein reflect the subjective views and opinions of Activant. Past performance is not indicative of future results. No representation is made that any investment will or is likely to achieve its objectives. All investments involve risk and may result in loss. This newsletter does not constitute an offer to sell or a solicitation of an offer to buy any security. Activant does not provide tax or legal advice and you are encouraged to seek the advice of a tax or legal professional regarding your individual circumstances.
This content may not under any circumstances be relied upon when making a decision to invest in any fund or investment, including those managed by Activant. Certain information contained in here has been obtained from third-party sources, including from portfolio companies of funds managed by Activant. While taken from sources believed to be reliable, Activant has not independently verified such information and makes no representations about the current or enduring accuracy of the information or its appropriateness for a given situation.
Activant does not solicit or make its services available to the public. The content provided herein may include information regarding past and/or present portfolio companies or investments managed by Activant, its affiliates and/or personnel. References to specific companies are for illustrative purposes only and do not necessarily reflect Activant investments. It should not be assumed that investments made in the future will have similar characteristics. Please see "full list of investments" at activantcapital.com/companies/ for a full list of investments. Any portfolio companies discussed herein should not be assumed to have been profitable. Certain information herein constitutes "forward-looking statements." All forward-looking statements represent only the intent and belief of Activant as of the date such statements were made. None of Activant or any of its affiliates (i) assumes any responsibility for the accuracy and completeness of any forward-looking statements or (ii) undertakes any obligation to disseminate any updates or revisions to any forward-looking statement contained herein to reflect any change in their expectation with regard thereto or any change in events, conditions or circumstances on which any such statement is based. Due to various risks and uncertainties, actual events or results may differ materially from those reflected or contemplated in such forward-looking statements.