Office of the CFO — February 11, 2025
The Future of Transfer Pricing
A Call To Action For CFOs

Transfer Pricing (TP)1 has long been one of the most intricate and high-stakes aspects of multinational enterprise (MNE) operations, yet it remains the most overlooked corner of tax technology. Companies spend millions each year on fragmented, inefficient solutions, often cobbling together patchwork software, manual processes, and expensive consulting support. Despite the high financial stakes – with MNEs facing hefty penalties, litigation costs, and audit disputes – we believe the status quo for TP remains deeply flawed.
The core issues are clear. TP processes are bogged down by siloed data, error-prone Excel spreadsheets, costly custom ERP integrations, and consultant-driven models provided by the Big Four and legacy players like Thomson Reuters (ONESOURCE), Wolter Kluwer and LexisNexis. As compliance costs rise, regulatory demands grow more complex and financial penalties escalate, making the cracks in this outdated system impossible to ignore. To illustrate the urgency, EY reported in 2022 that MNEs spent an average of $37.4 million on tax reassessments related to TP disputes and an additional $31.8 million on penalties, legal fees & litigation.2
Achieving accurate TP requires a comprehensive view of detailed, transaction-level data across an MNE’s global network of entities, often numbering in excess of 225 for large enterprises. This data must dynamically update to reflect changes in internal structures and greater than 6+ regulatory requirements. However, legacy technology solutions fail to meet these demands. Most existing platforms focus narrowly on compliance documentation and basic TP benchmarking, while ignoring the broader need for a holistic, end-to-end TP solution.
Add AI and automation investments into the mix, and the industry is at a transitioning point. No longer just a compliance obligation, TP has the potential to become a strategic lever for value creation. The future of TP is no longer reactive, it’s proactive, dynamic, and strategic.
This article is a call to action for CFOs and decision-makers. If your organization isn’t leveraging Operational TP or Strategic TP tools, you’re not just behind the curve, you’re leaving money on the table. TP is transitioning from a back-office burden to a key driver of efficiency and profitability.
Breaking Down Transfer Pricing
Transfer pricing is often viewed as a single domain, but its complexity emerges from its three identifiable segments: Strategic Transfer Pricing (STP), Operational Transfer Pricing (OTP), and Transfer Pricing (TP) Compliance.
These are distinct yet interconnected. Put simply, STP defines the group-wide policies for transfer pricing; OTP represents the tools through which these policies are implemented; and in TP Compliance, MNEs report on the previous two, either internally or to the respective regulator.
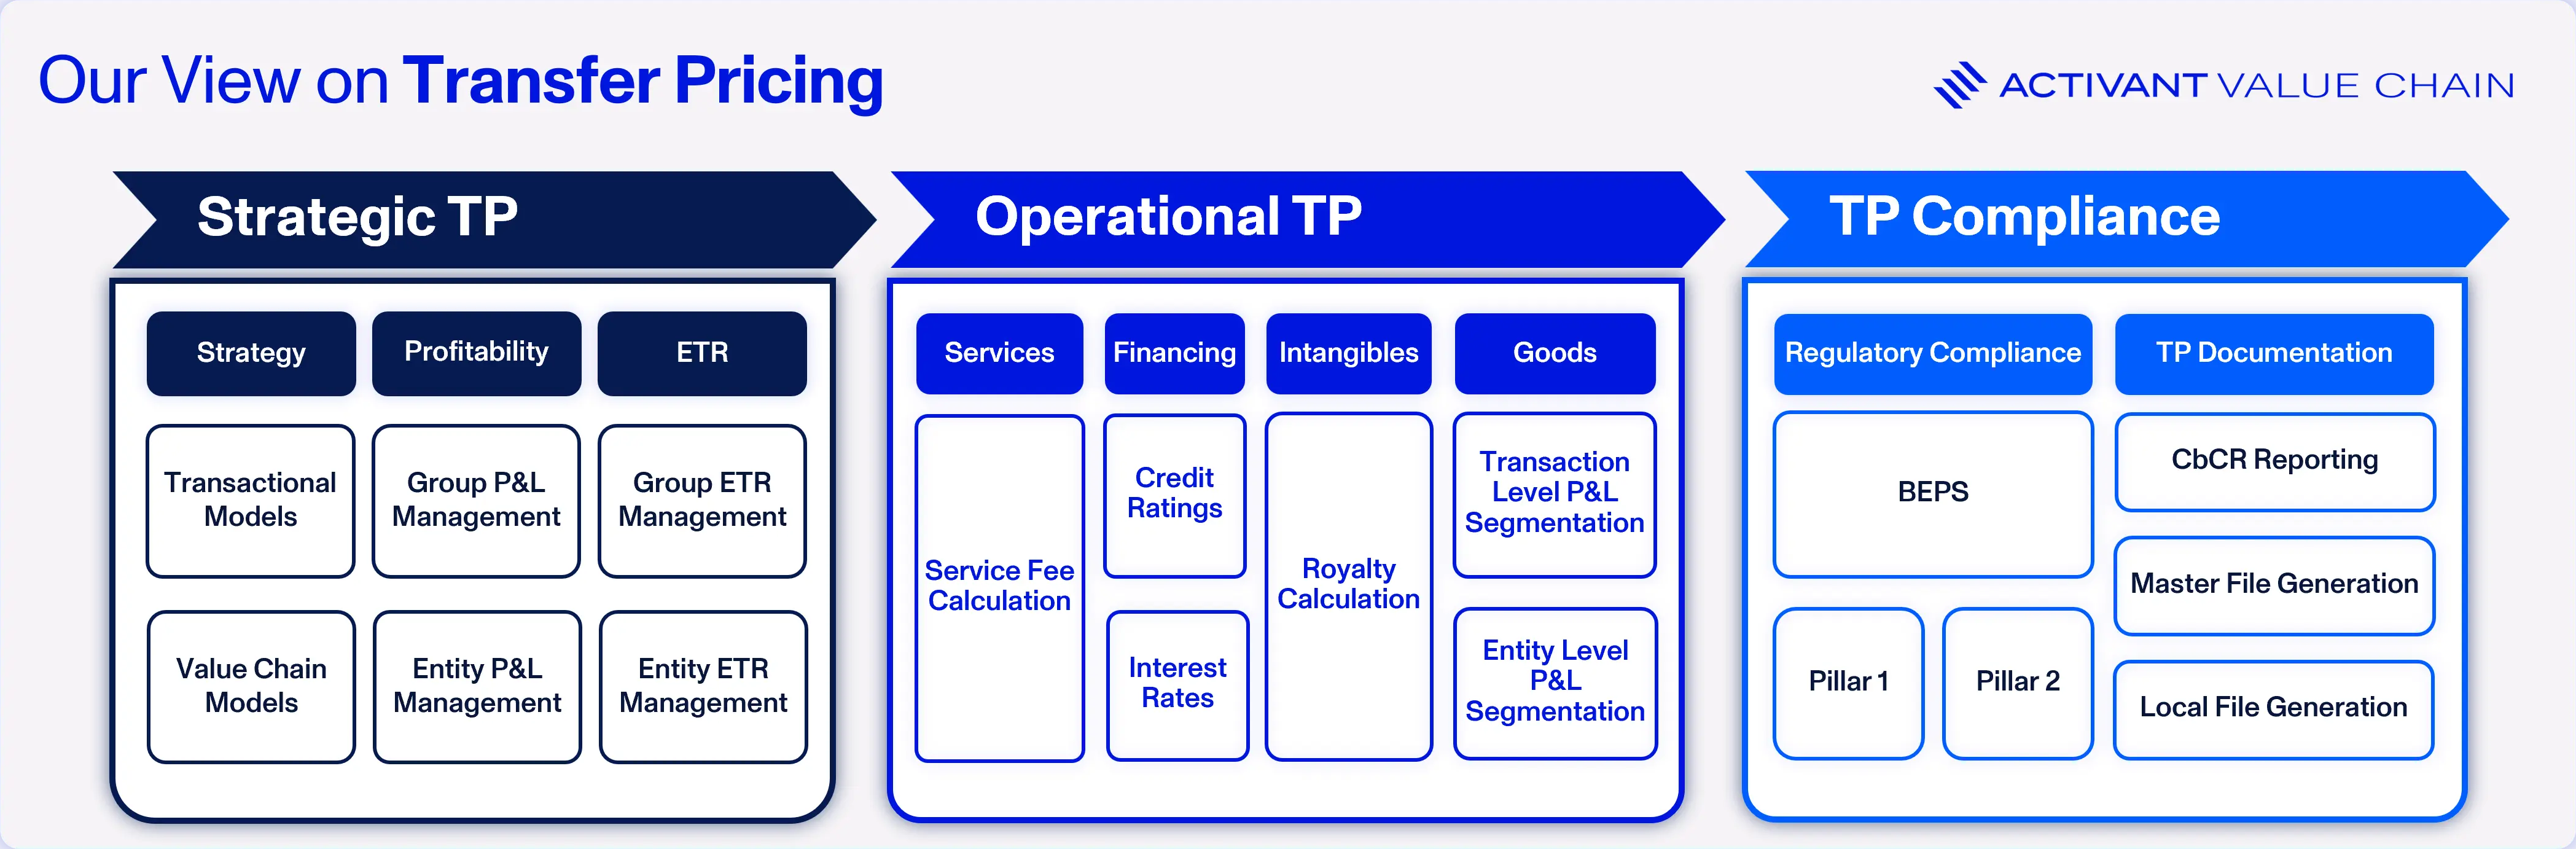
1. Strategic Transfer Pricing: the practice of aligning long-term TP policies with overall corporate strategy, offering arguably the greatest potential for optimizing tax outcomes and driving value. However, the technology for fully automated STP solutions is still in its infancy.
- MNEs rely heavily on Big Four consultants to perform value chain analyses, assess risks, and develop effective tax rate (ETR)3 management plans.
- Strategic planning has been limited by fragmented data and lack of real-time insights, often leading to missed opportunities for tax optimization.
The Potential for Automation: Tech innovation within STP could introduce scenario planning and ETR management tools that:
- simulate financial outcomes under various scenarios, empowering MNEs to make proactive adjustments to global profit allocation.
- automate value chain mapping and data standardization, ensuring alignment between business strategy and TP policies.
- integrate regulatory changes into the strategic framework, reducing reliance on consultants for ongoing adjustments.
- align actual tax potential and ETR, thereby reducing group aggregate ETR, and saving corporations millions in the process.
2. Operational Transfer Pricing (OTP): OTP involves the day-to-day management of intercompany pricing to ensure transactions align with the arm’s length principle4 (benchmarked to industry norms). Key features also include royalty calculations and P&L segmentations.
- Adjustments for market changes, such as currency fluctuations or demand shifts, were made annually, requiring expensive consultant-driven projects.
- Tools like Optravis provide monitoring dashboards, but real-time data handling and adjustments are limited.
- A patchwork of ERP modules and manual processes leave MNEs struggling to achieve ongoing adherence to standards, often resulting in financial discrepancies.
The Potential for Automation: Although in its infancy, companies such as EXA AG, Intercompany, Reptune (formerly TP Tuned) and Aibidia are pioneering automation in OTP through:
- real-time price adjustments that adapt to changing market conditions, integrated with ERP systems.
- monitoring dashboards that provide actionable insights, such as credit rating adjustments and profit allocation tracking.
- year-round usability, enabling continuous compliance rather than periodic updates.
3. Transfer Pricing Compliance: TP Compliance focuses on ensuring MNEs meet local and international regulatory requirements, such as BEPS (Base Erosion and Profit Shifting) Action 13 outlined by the OECD. These requirements have three levels: MNEs are required to produce Local Files (country-specific documentation), Master Files (overview of an MNE’s business activity and transfer pricing methodology), as well as Country-by-Country Reports (overview of business activities for tax authorities). These documents are a direct result of what was decided in OTP: in other words, the outputs of OTP are the inputs for compliance, and it makes sense to have both on one platform.
- Data collection and consolidation has been manual, with controllers needing to extract siloed datasets from Excel, ERP systems (e.g., SAP, Oracle), and databases like Bloomberg and Orbis.
- Documentation preparation has been a labor-intensive process, often outsourced to the Big Four or regional consultants.
- Errors, inconsistencies, and extended turnaround times are common due to manual reconciliation and misaligned templates across subsidiaries.
The Potential for Automation: Companies are transforming compliance by automating the end-to-end documentation process in the following ways:
- Platforms like Aibidia and Exactera provide updates to regulatory changes, eliminating costly re-implementation cycles, while IntraPricing Solutions’ TP Genie can provide recommendations based on OECD guidelines and local regulations.
- Some systems integrate with ERP solutions via APIs, ensuring data consistency across subsidiaries.
- Automated generation of compliance reports reduces manual effort and ensures accuracy. We believe that generative AI will be particularly impactful in this field, where some of the Big Four are developing internal products.
The Real ROI of Transfer Pricing: A Strategic Margin Driver
TP offers a pathway to improved margins and enhanced profitability. On the cost side, automation reduces reliance on costly consultants and internal operating expenses while also mitigating compliance risks tied to steep penalties for errors. However, the most compelling ROI driver lies in margin optimization. For a company generating $100 million in operating income, a 1-percentage-point reduction in its effective tax rate (ETR) translates to an additional $1 million in annual net income. In other words, that’s a 10% increase in net margins resulting in a 10% gain in profits.
ROI Based on Cost Reduction
Compliance Costs: For organizations globally, TP compliance is becoming an increasingly costly endeavor. A Tax Foundation survey of 21 large MNEs (averaging $81 billion in revenue) found an average annual tax compliance spend of $25.6mn per company, with costs rising by a weighted average of 32% between 2017 and 2023.5 Activant estimates that an MNE with ~$750mn in revenue spends ~$2mn on TP compliance alone.6
Technology Costs: Automation is essential, especially for under-resourced tax departments. Custom-built ERP can cost corporations anywhere between $2-$5 million,7 while off-the-shelf solutions offer comparable business outcomes at a fraction of the price. A Thomson Reuters 2022 report states that companies with median revenues of $3.4 billion allocate approximately $1.8 million to external and internal tax technology budgets, which is about 0.05% of their revenue.8 We expect this to increase as more than 50% of decision makers reported having under-resourced tax teams.9 Tech will have to bridge the gap in TP, as is being done by players in other segments of the tax market, such as Taxdoo for automated sales tax and VAT, and Incentify for tax credit claims and management.
Filling the Talent Gap and Reducing Manual Workload: The 2024 EY International Tax and Transfer Pricing Survey found that 50% of respondents cite talent acquisition as a key concern. Meanwhile 78% highlighted OTP as a moderate to significant risk over the next 3 years,10 with tax professionals looking to reduce time spent on routine compliance activities by at least 10% to focus on strategic initiatives.11

“Compared to our previous provider, Aibidia’s software offers a self-service solution that’s 80% more capable, eliminating the need for constant manual intervention. With Aibidia, figures can be updated, sections modified, and documents with all attachments generated in minutes, saving hours of manual work.”
Penalties and Litigation Costs: From the same 2024 EY survey, respondents (1000 executives from large corporations) reveal that in 2022 alone MNEs spent an average of $37.4 million on tax reassessments, $15.4 million on penalties, and $16.4 million on legal fees.12 Failures in operational decisions and compliance often drive these costs, underscoring the value of OTP and TP compliance.
Audit Cost Reduction: Increasing regulatory scrutiny has driven more frequent and costly TP audits. Modern OTP tools consolidate data, providing a single view for tax authorities, pre-empting costly audits, and saving millions annually. Compounding this, the IRS has strengthened its position on TP enforcement in recent years as shown in the following examples:
- Coca-Cola: The U.S. Tax Court ruled on August 2, 2024, against Coca-Cola, determining a $2.7 billion underpayment for 2007–2009. Interest is expected to raise the liability to $6 billion.
- Microsoft: The IRS claimed $28.9 billion in unpaid taxes for 2004–2013 due to licensing of intangibles to entities in Puerto Rico, Dublin, and Singapore.13
Double Taxation Risk Mitigation: Real-time OTP solutions help prevent double taxation by enabling intra-entity pricing adjustments throughout the year, ensuring compliance with the arm’s length principle. EY’s 2024 survey reveals 84% of professionals view double taxation risks as significant, driven by global tax reforms, while 75% cite ineffective use of technology as a major challenge.14
ROI Based on Margin Improvements
ETR Improvements: With a platform that removes the decoupling of STP, OTP and TP Compliance based on a unified data layer, companies can materially improve their effective tax rate. OECD data shows the average ETR for large MNEs is ~25%,15 while the Global Minimum Tax proposal for MNEs aligns countries to a lower minimum ETR of 15%. When you apply that 10-percentage-point difference to the taxable operating income of MNEs (those with revenues >$750mn), you get an idea of the potential size of the opportunity.
The Market
Leveraging data from Eurostat,16 OECD ADIMA,17 and Bureau van Dijk (Moody’s),18 we estimate there are 65,000 MNEs globally, encompassing approximately 4.6 million legal entities. Europe hosts 19,000 MNEs with an estimated 1.3 million legal entities, while North America accounts for 17,000 MNEs and 1.2 million legal entities. By combining this data with expert insights into the annual costs for compliance, OTP, and STP consulting and advisory, our conservative bottom-up market sizing analysis estimates a global TAM of ~$40 billion and SAM of ~$20 billion.19
For perspective, the Big Four accounting firms collectively generate over $42 billion annually from tax services (not limited to TP),20 illustrating the scale of the broader market.
TP in Transition: A Slow Adopter in The Tax World
In the broader tax landscape, automation and AI have been widely embraced to streamline processes, reduce errors, and optimize outcomes.
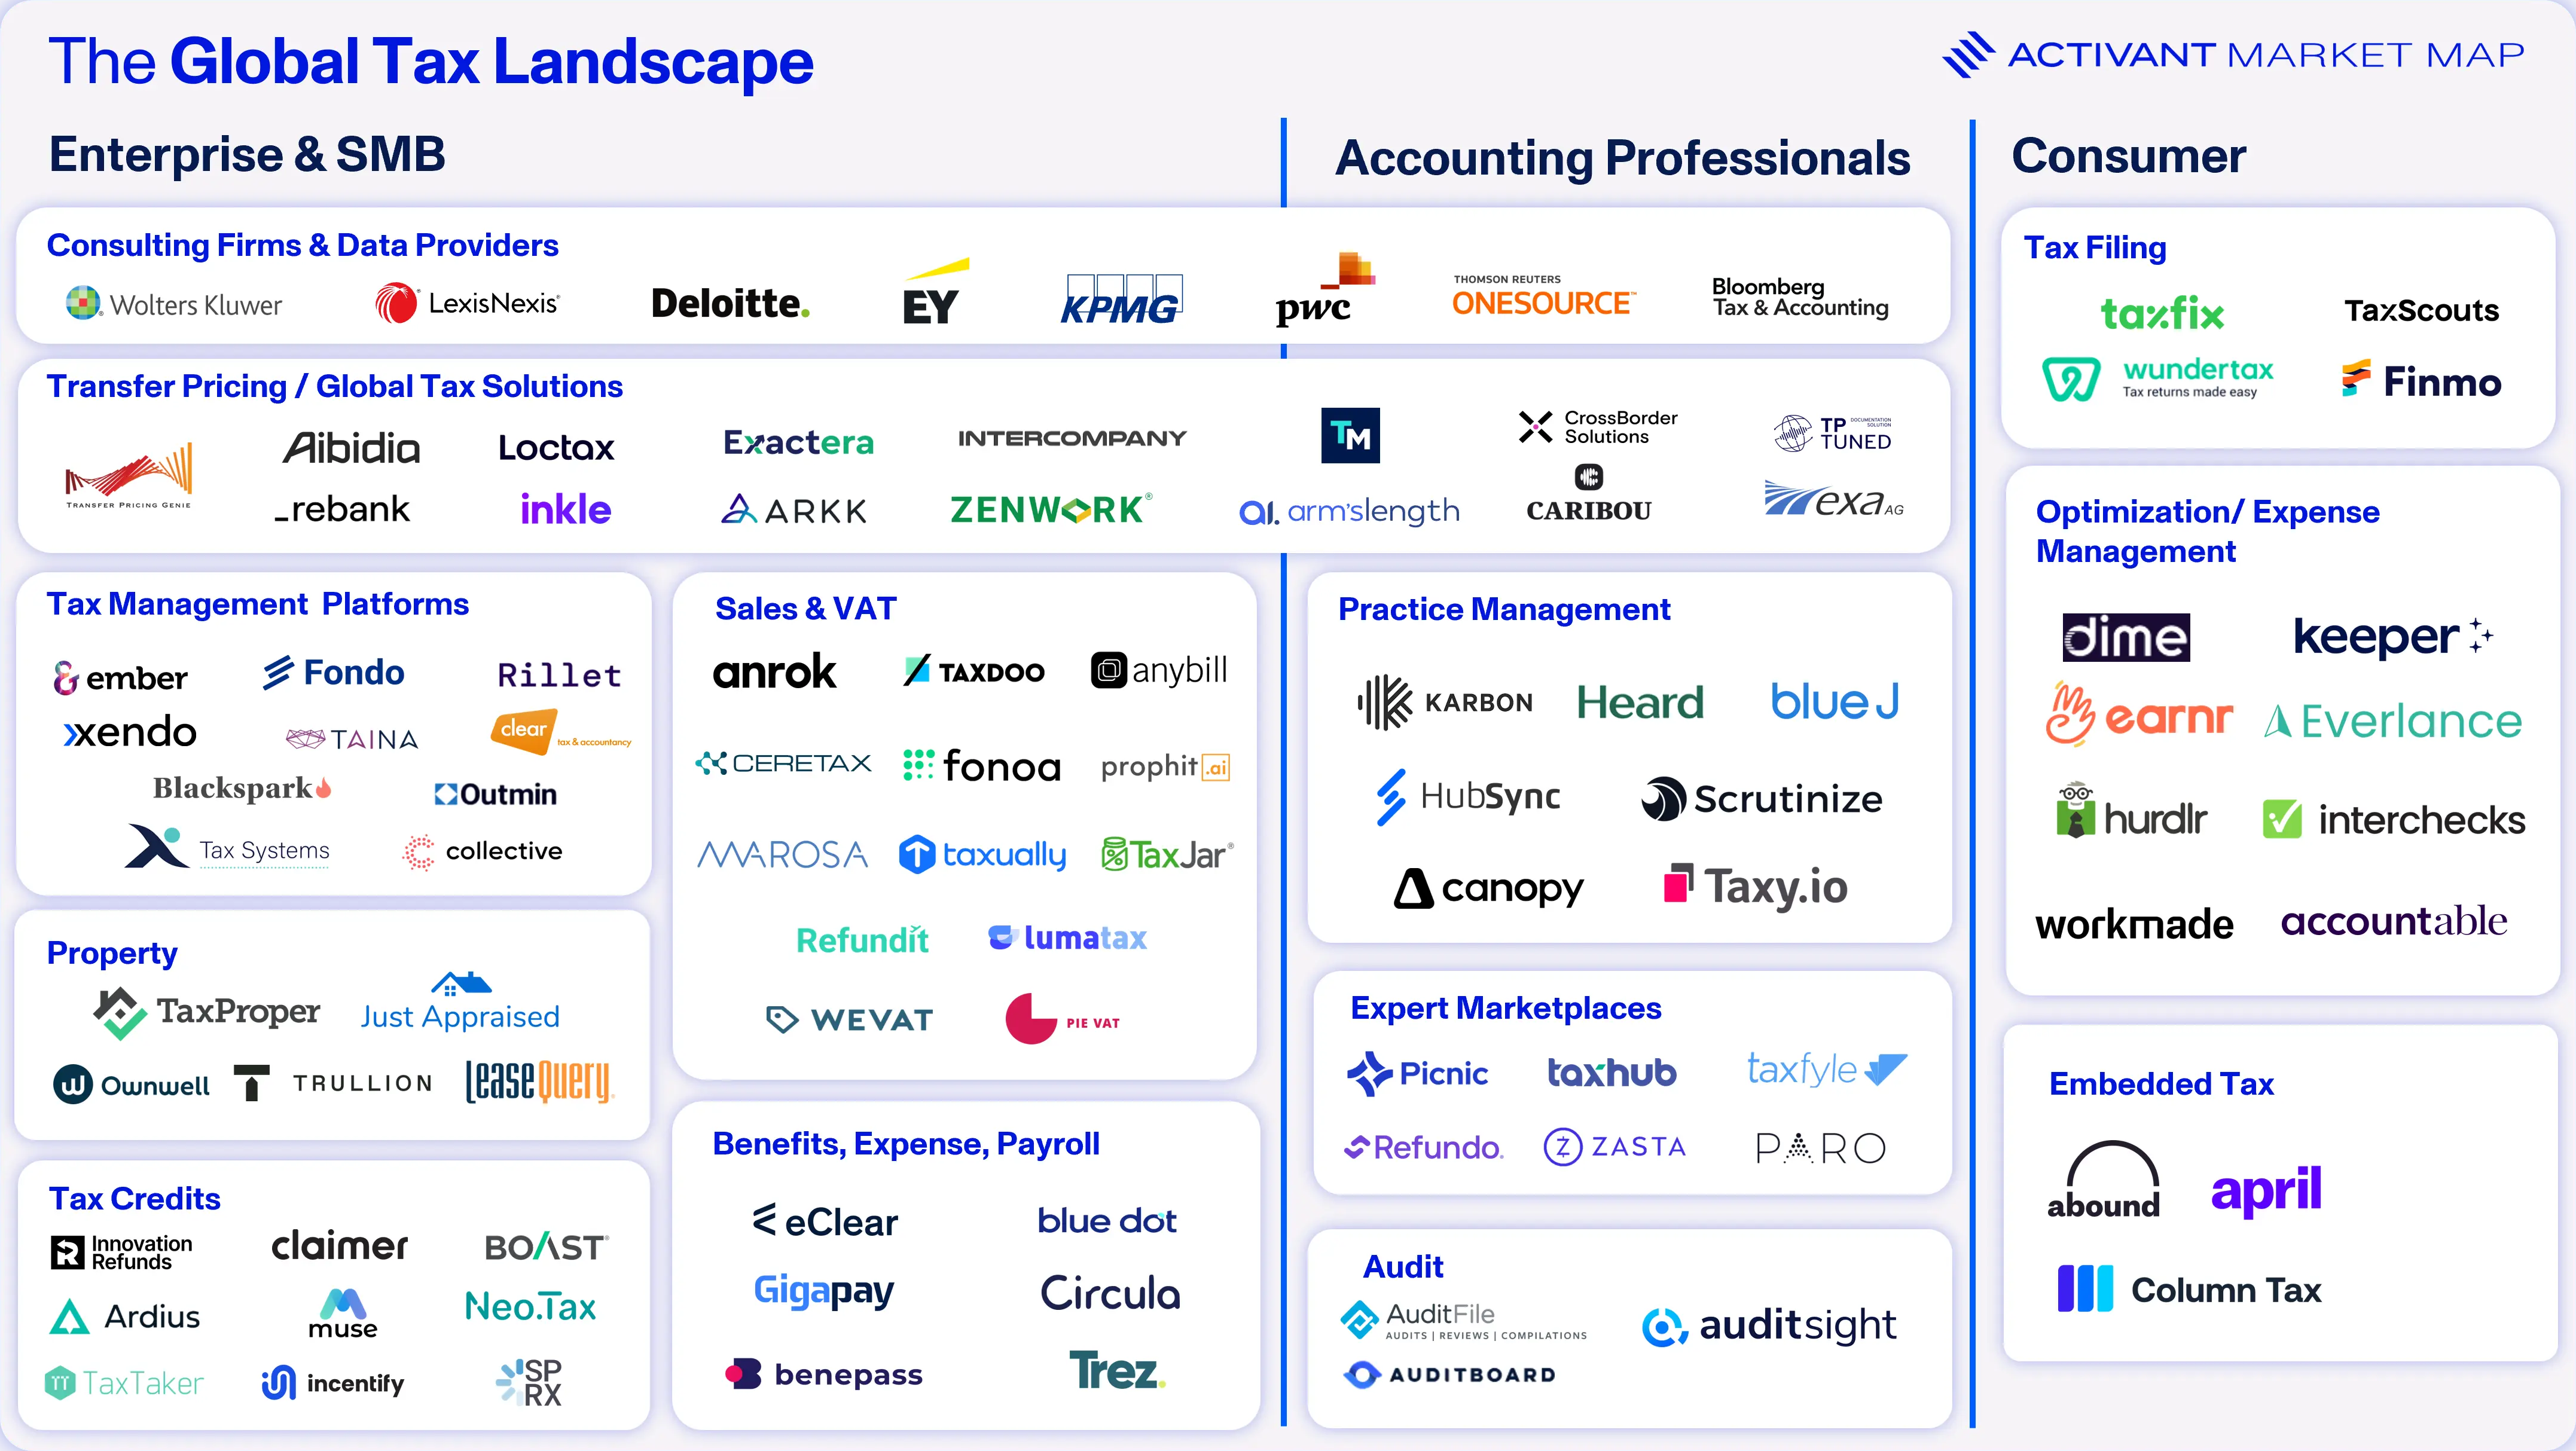
Corporate tax filing, payroll management, and compliance documentation have experienced remarkable advancements in recent years. Companies like Fonoa, Taxdoo, Anybill, and TaxJar have automated sales tax and VAT, while innovators such as TaxTaker and Incentify have transformed how tax credits are claimed and managed. Platforms like Ember, and Fondo are streamlining tax management for consumers, and solutions like Taxfix and Finmo are redefining the user experience for individual tax filers. For accounting professionals, tools such as Karbon and Taxy.io are enhancing efficiency and collaboration within tax workflows.
Despite advancements across various tax domains, TP and Cross Border Tax & Business Management remains laggard. Innovation is burdened by entrenched manual processes, fragmented workflows, and –last but not least – the Big Four and other TP consultancies protecting their service revenues.
Tailwinds are Blowing
The landscape is undergoing a shift, driven by several tailwinds:
1. Transparency is No Longer Optional: Global regulatory frameworks are increasingly emphasizing transparency in corporate tax practices. In addition, the regulatory landscape has never been more complex.
- Public Country-by-Country Reporting (CbCR): With impending public disclosures in the EU, MNEs with consolidated revenues exceeding $750 million will be required to publish detailed financial and tax data on their medium and large subsidiaries, intensifying the demand for accurate, centralized, and transparent reporting. EU public CbCR reporting first came into effect in June 2024.21
- Stakeholder Pressure: Shareholders, investors, and the public are demanding greater visibility into corporate tax practices, compelling companies to adopt more transparent and accountable systems. EY’s 2023 survey reports that 92% of respondents indicated plans to disclose at least three additional pieces of tax-related data to the public, going beyond what current regulations mandate.22
- BEPS Initiatives: The OECD’s BEPS framework has introduced stringent requirements, including Pillar Two’s global minimum tax and tighter intercompany pricing rules. Thomson Reuters’ survey of corporate tax professionals ranked Pillar Two as the most significant challenge for tax departments.23
- Global Convergence: With over 145 countries aligning to the OECD guidelines on base erosion and profit shifting (BEPS),24 TP regulations are becoming more uniform but simultaneously more demanding.
- Tax Authority Audits: With 65% of global tax administration authorities integrating AI into their daily operations (including the IRS),25 MNEs are facing greater risks of audits, disputes, and penalties.
- Increased IRS scrutiny likely with 2025 oval office change: The Trump administration is likely to continue their previous protectionist strategy, building on their previous policies such as the Tax Cuts and Jobs Act (2017). Provisions like GILTI and BEAT further raise compliance scrutiny for MNEs in the US. GILTI imposes a minimum tax on foreign earnings,26 while BEAT targets tax base erosion through deductible payments to foreign affiliates, increasing scrutiny of cross-border intercompany transactions.27
2. Real-Time Data Integration is Becoming Essential: Modern TP requires real-time access to financial and transactional data.
- Regulatory Compliance: Regulatory authorities are requiring more granular, real-time data to evaluate adherence to the arm’s length principle.
- Dynamic Adjustments: Real-time data integration, combined with a holistic platform, transforms OTP into a powerful value driver. By seamlessly incorporating dynamic internal and external adjustments such as benchmarking and company restructuring, OTP can be unlocked as a value driver for organizations, rather than the secondary consideration that it currently is.
3. Cost-Cutting Imperatives in a Challenging Economy: In an era of economic uncertainty, cost efficiency is paramount.
- Labor-Intensive Processes: Legacy methods rely on high labor input, including in-house teams and external consultants.
- Expensive Consulting Models: Big Four firms have traditionally offered high-touch, high-cost services, which are increasingly unsustainable for many MNEs. Compliance documentation is a high-margin business for advisors who charge $5-$10k per compliance filing, a task often performed by juniors. In conversation with a large MNE (~$10bn in revenue), they revealed spending $500k solely on advisory services (excluding labor costs) to prepare local P&Ls for 100 group entities.28
4. Tax Technology Budgets on the Rise: The strategic importance of technology in tax departments is growing, with businesses increasingly prioritizing tech investments, outlined below by companies surveyed by Thomson Reuters.29
- Small Business Emphasis: Enterprises with revenues under $50 million allocate up to 25% of their tax budgets to technology.
- Mid-Sized Growth: Companies earning $1–$6 billion are leading the charge, with 60% projecting tech budget growth surpassing typical annual increases.
- Large Corporations Following Suit: 58% of companies with revenues above $6 billion also expect significant upticks in tax technology spending.
- Tech Investment Reduces Tax Spend Needs: Companies that allocate more than 10% of their tax budgets to technology spend ~0.86% of their overall revenue on tax operations, while those spending less than 10% incur an additional 0.1%.30 For a company with $1 billion in revenue, this means an extra $1 million would need to be allocated to their tax team.
The increased appetite for technology within tax departments – across companies of all sizes – signals growing momentum for sector modernization.
Market Dynamics and Moats for TP Tech
The TP market not only benefits from tailwinds, but also enjoys unique market dynamics.
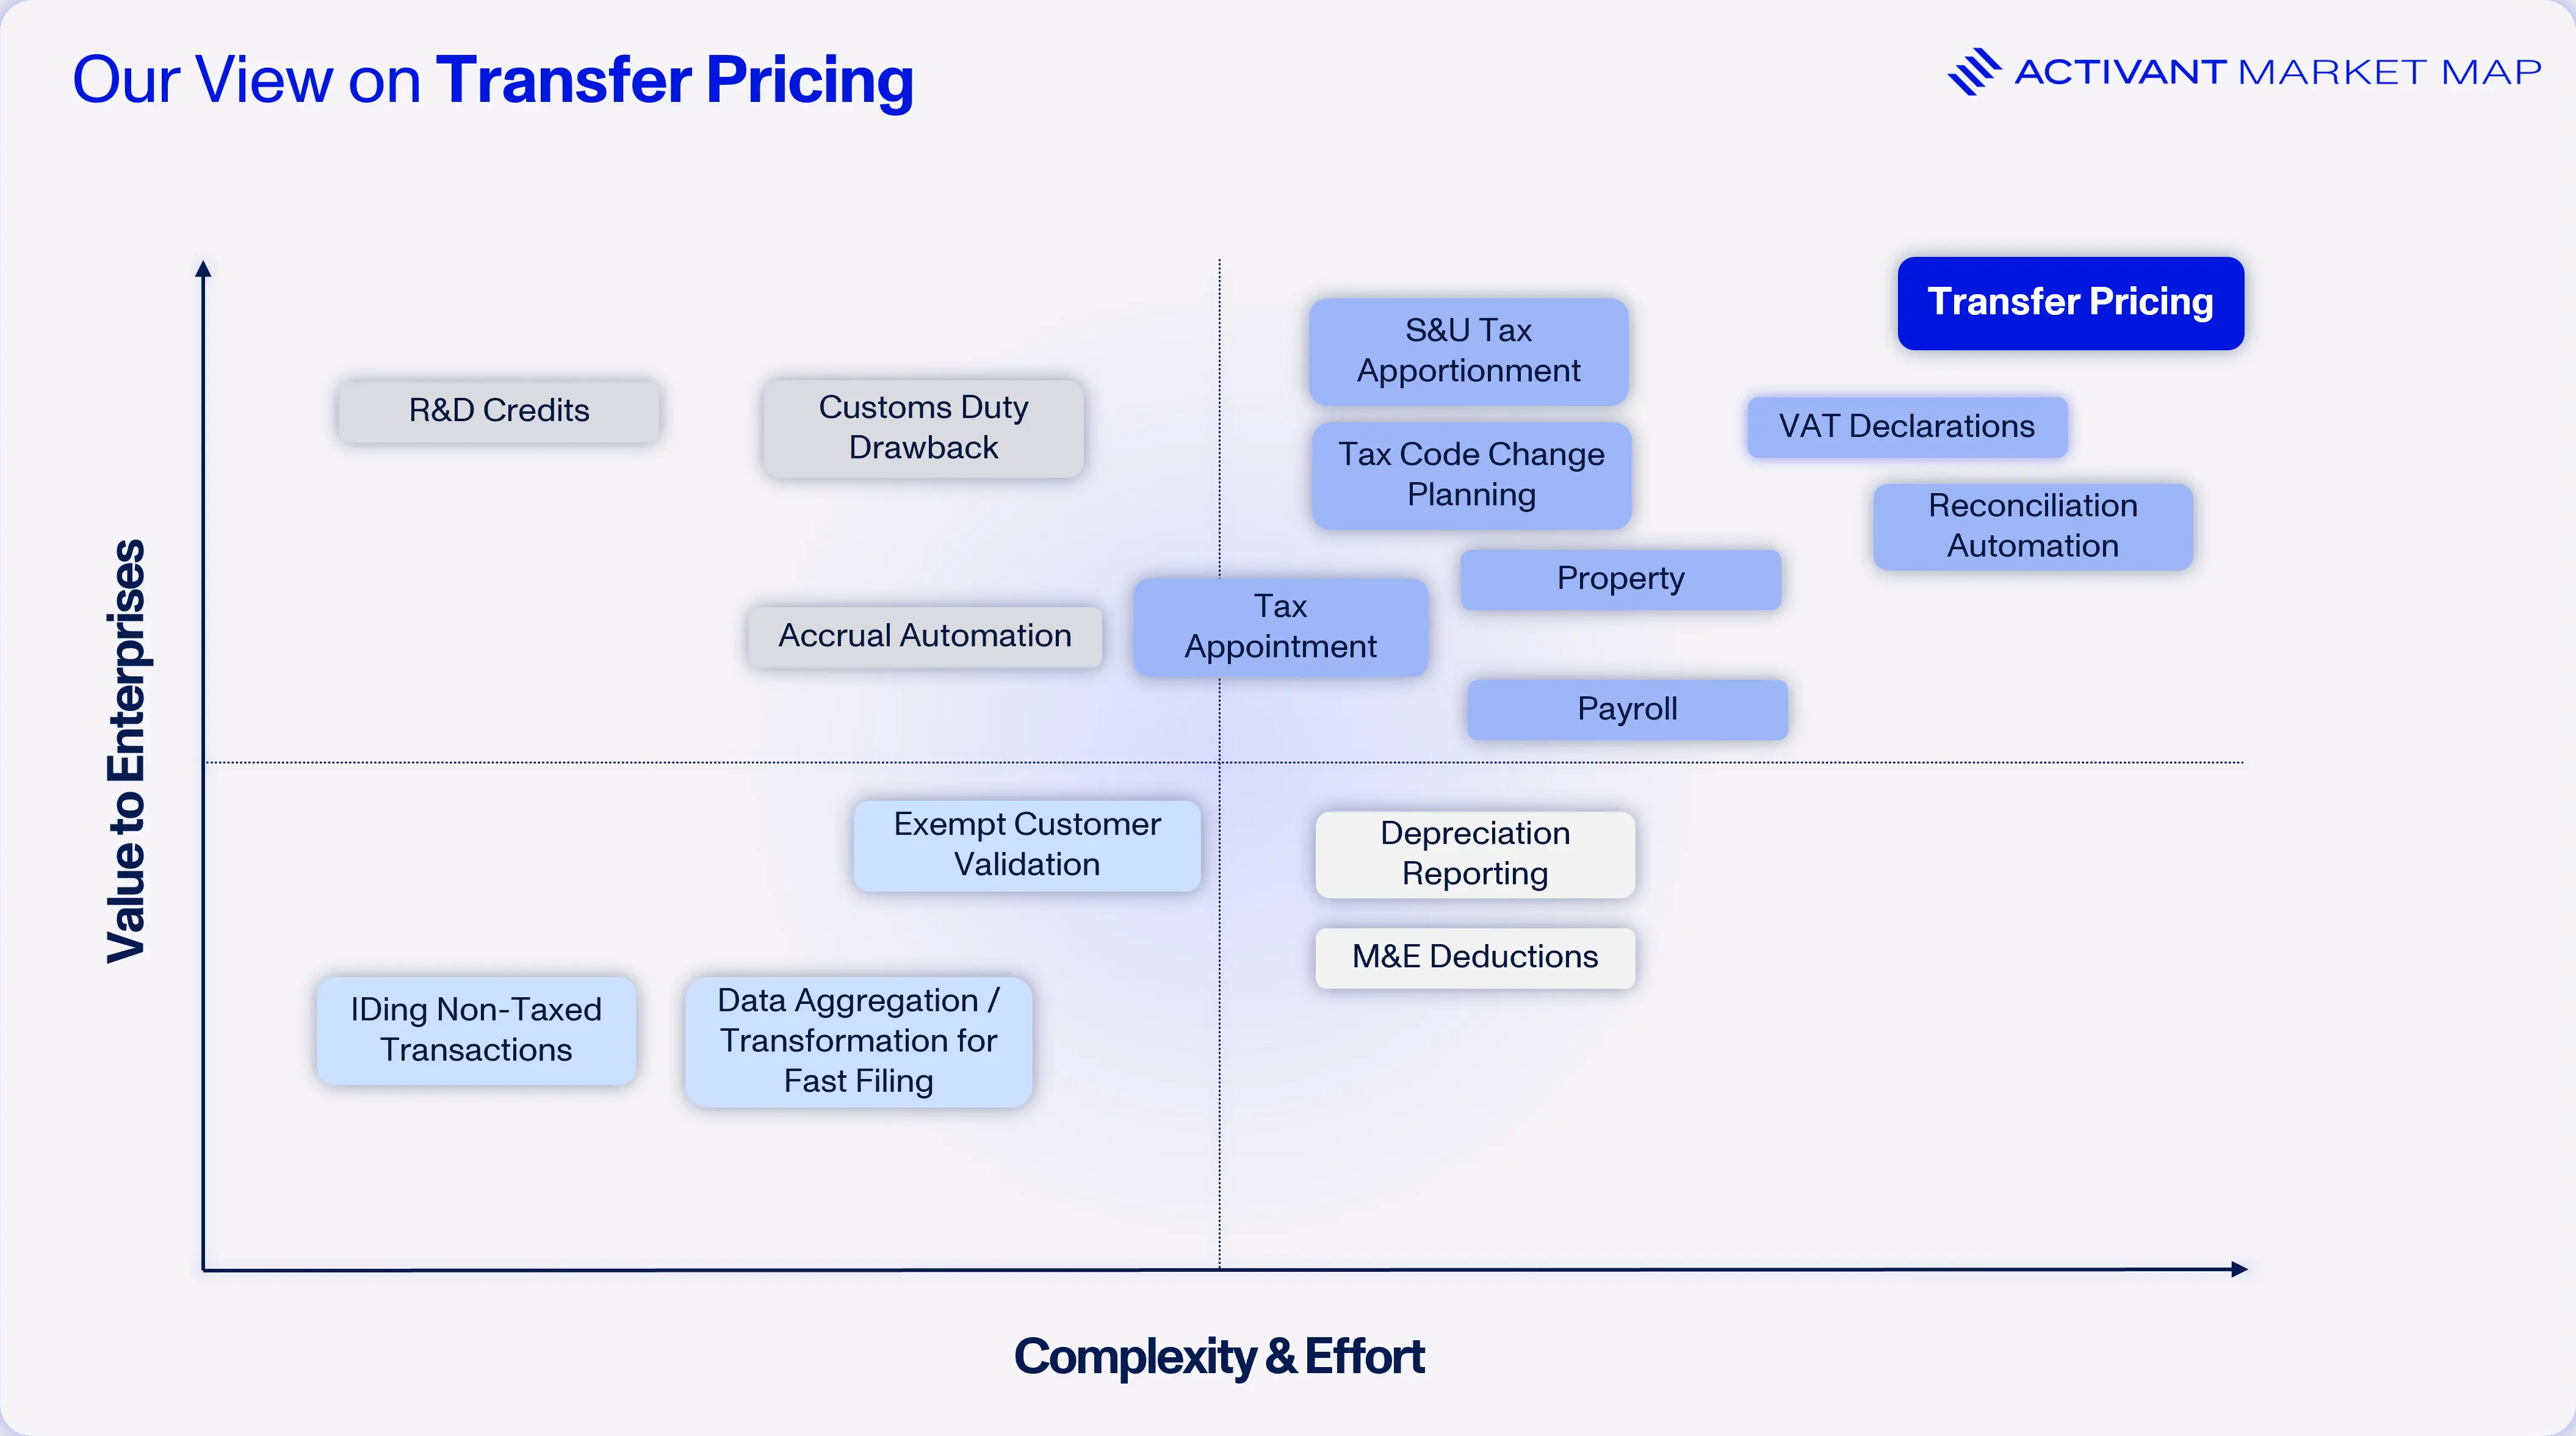
TP stands out as it requires significantly more effort and human capital than other tax segments, while having the potential to deliver greater value to enterprises. The following dynamics, combined with the tailwinds mentioned above, make TP unique within tax tech:
1. High Customer Lock-In: The software embeds deeply into organizational workflows, integrating with ERP systems and addressing complex regulatory requirements. This integration results in high switching costs once data is integrated into platforms.
2. Upselling Opportunities: TP Compliance acts as a gateway for MNEs to adopt more advanced capabilities like OTP and STP. Companies that automate compliance will naturally expand into these higher-value segments, creating opportunities for end-to-end solutions addressing the full spectrum of TP needs.
3. High Barriers to Entry: Due to its inherent complexity, building a powerful (data) product not only takes time, but also requires a unique combination of software talent and TP experts. Barriers to entry are further solidified by entrenched client-consulting relationships and expectations for fault-free products given direct compliance exposure, which suggests that consultants will remain a part of this market (as a source of comfort for tax/compliance teams) for the foreseeable future.
4. Defensibility against AI/LLM wrappers: Given the complexity of developing a TP product (and the challenge of translating tax regulation into data models in a way that can be updated continuously), the need to be deeply integrated into a company’s data stack (down to transaction-level data), and the requirement of having access to non-public data for benchmarking, we believe that TP is well-protected against off-the-shelf AI/LLM wrappers. At the same time, once deployed, TP products are ideally positioned to leverage AI.
5. Non-cyclical/recession-proof: TP is compliance-driven, ensuring consistent demand regardless of economic conditions. Its focus on regulatory adherence and cost-saving opportunities makes it a resilient market, even during recessions.
6. Legacy players are following a different model and falling behind: Despite the growing demand for automation, legacy providers have struggled to adapt their products. Beyond that, their business models often have a material services component, making their offerings comparably expensive and creating a cannibalization conflict.
7. Potential for Strategic Partnerships: Established players like SAP and the Big Four accounting firms are increasingly partnering with TP technology providers – for example Aibidia has partnered with the IBFD (International Bureau of Fiscal Documentation) – and these collaborations enhance market credibility and provide opportunities for co-developing integrated solutions. Activant believes it is conceivable that these strategic partners will acquire the tech solutions as they mature.
The (Big Four) Elephants in the Room
PwC, Deloitte, KPMG, and EY, alongside legacy players like Thomson Reuters, Wolters Kluwer, and LexisNexis, dominate the TP landscape. EY, PwC, and KPMG each reported 7% year-over-year growth in tax-related revenue. EY generated $12.08 billion (24% of total revenue), PwC earned $12.6 billion (23%), and KPMG reported $7.9 billion (22%). Thomson Reuters’ Tax & Accounting segment also saw 7% growth, contributing $1.058 billion (16% of total revenue). Wolters Kluwer’s Tax & Accounting business achieved €1.466 billion in 2023, representing 26% of its revenue with a slightly lower growth rate of 5%.
While these incumbents pose a competitive risk to any company seeking to automate TP, they are often hindered by reliance on high-cost, labor-intensive services and outdated, siloed technology that struggles to keep pace with evolving regulatory demands.
While automation in TP could be seen as “eating the Big Four’s lunch,” particularly by impacting their highly profitable tax advisory segments, expert insights suggest a more nuanced reality. Initially met with skepticism, TP tech has gradually been embraced by the Big Four as a complement to their offerings. This is evident in their partnerships with technology providers: Deloitte and PwC collaborate with Optravis, and Deloitte with SAP. Additionally, Thomson Reuters’ ONESOURCE platform is frequently integrated into advisory projects. These alliances highlight how even the largest incumbents are beginning to adapt, leveraging tech partnerships to enhance efficiency while preserving their advisory dominance.
What it will Take to Win
We believe that for tech players to win in this marketplace moving forward, they must be able to address key TP pain points by offering the following:
1. A new source of TP truth for MNEs: This will be achieved through a combination of the following:
- Deep integration of tech with a company’s ERP, allowing for real-time data updates.
- Capability to update MNE data models and TP calculations dynamically to account for changes in regulations and ever-evolving group entity structures.
2. Stakeholder collaboration: It is critical for platforms to enable seamless interaction among all stakeholders involved in TP, e.g., MNE internal tax teams, local subsidiary controllers, and external consultant teams.
3. Modular system architecture with future AI integration: Providers must design their solutions to allow for the future integration of AI agents, enhancing their platform’s ability to evolve and improve their services over time. For more insights on the future direction of AI agents, refer to our updated research article: Towards the AI Agent Ecosystem.
4. A combination of OTP and TP Compliance in one: Companies offering a unified platform that addresses both OTP and TP Compliance will best meet MNE requirements, as OTP outputs serve as the input for TP Compliance documentation. Vitally, platforms must be integrated sufficiently deep to do this on a dynamic basis (see Point 1.).
5. The Differentiator – Dynamic STP: Unifying dynamic OTP and TP compliance in one piece of software is the immediate next step for MNEs but these two areas primarily realize the (already significant) ROI of operational costs savings and reduced compliance costs. To become a strategic margin driver and thus achieve exceptional ROI, platforms will ultimately need to offer dynamic STP to achieve reductions in ETR.
Who Stands Out
Given the outlined market dynamics, tailwinds, moats, and the inherently complex, legacy-driven nature of TP, we see the following startups – and some more mature company solutions – gaining the most market traction compared to legacy listed incumbents, other software providers, and the Big Four.
While we believe the market is still in its infancy, the most notable innovation can be found within the Compliance TP landscape, with some OTP functionality. Exactera and EXA AG offer OTP and Compliance TP document solutions, while Loctax’s platform includes global tax compliance and controversy management with TP functionality. Other market offerings accent their Compliance TP capabilities. For example, TP Genie from IntraPricing Solutions provides dashboard and workflow solutions for MNEs. Optravis (an MSG company) and TP Tuned offer a hybrid solution of TP management software and consulting services.
However, these solutions have not yet been able to provide truly dynamic TP data models that integrate into ERPs down to transaction level while auto-updating for changes in regulations and MNE’s group structures. In other words, they have alleviated but not fully overcome the problem of manual consultant reviews and costly re-implementations.
We believe the company that sets out to meet this challenge. In our opinion, is best positioned to win this market because it will tick all the following boxes:
1. Establishes a new source of truth: Building a data layer that uses TP domain-specific, proprietary ML and LLMs to translate a customers’ raw ERP/transaction data into a standardized taxonomy, which auto-updates for changing tax laws and group structure. This enables an platform to become truly dynamic, eliminating the need for costly, cyclical product reimplementation that plague other solutions.
2. Stakeholders can collaborate internally and externally: Compliance documentation can be submitted to the regulator from within the platform in eligible countries, while tax, finance, accounting, legal and IT teams can collaborate in role-based workflows.
3. The system architecture is modular: The platform has a separate data layer, meaning it is ideally positioned to leverage AI through multi-agent orchestration.
4. It combines OTP and Compliance: If a customer uses an OTP product, compliance documentation can be generated with minimal effort. Because the data model is dynamic, the need for human review is reduced.
5. The Differentiator – STP is coming: The dynamic data layer is already a profound differentiator. But from what we know, Aibidia one of Activant’s portfolio companies is expecting a first customer to go live with a commercial STP product in 2025. We expect the market is following suit.

“With Aibidia, we are transforming transfer pricing from a reactive, manual process into a proactive, strategic advantage, helping CFOs capture opportunities previously out of reach and leaving less money on the table. By unleashing the power of dynamic STP and integrating it into our platform, MNEs can optimize their effective tax rate, drive real margin improvements, and achieve true strategic alignment.”
Final Thoughts
At Activant, we see TP placed at a critical inflection point. For far too long, this area of tax management has been burdened by outdated, manual processes, expensive consultant-driven models, and fragmented/siloed systems.
The shift in the market is obvious, considering the tail winds, ROI and market dynamics together with Activant’s estimated market size of $40bn. We believe the opportunity for MNEs is clear: those who modernize their approach to TP compliance, OTP, and STP will reduce costs, optimize ETR, and enhance profitability. The opportunity for startups in this space is even clearer – those who can build solutions that provide this value to MNEs will benefit from substantial competitive moats, particularly startups building OTP and STP solutions.
While TP Compliance documentation products have become more commonplace, with emerging signs of OTP innovators, we have yet to identify market players that have developed a notable solution for STP, leaving the playing field wide open.
For those building in the space, please get in touch!
Footnotes
-
Transfer Pricing (TP): refers to the rules and methods for pricing transactions within and between subsidiaries under common enterprise ownership. ↩
-
EY, International Tax and Transfer Pricing Survey, 2024. ↩
-
Effective Tax Rate (ETR): The percentage of pre-tax income a company pays in taxes. It reflects a company’s actual tax burden, including local, federal, and international taxes, as opposed to the statutory rate. ↩
-
Arm’s length principle: ensures that transactions between related parties, e.g., MNE subsidiaries, are priced as if they were between independent, unrelated parties in a competitive market. ↩
-
Tax Foundation, Results of a Survey Measuring Business Tax Compliance Costs, 2024. ↩
-
Activant, Estimate based on expert consultations, 2024. ↩
-
SelectHub, How Much Does ERP Cost?, 2024. ↩
-
Thomson Reuters Institute, The State of the Corporate Tax Department, 2022. ↩
-
Thomson Reuters Institute & Tax Executives Institute, State of the Corporate Tax Department, 2024. ↩
-
EY, International Tax and Transfer Pricing Survey, 2024. ↩
-
EY, TFO Survey, 2023. ↩
-
EY, International Tax and Transfer Pricing Survey, 2024. ↩
-
Bloomberg Tax, Microsoft’s $29 Billion Tax Bill Offers Transfer Pricing Lessons, 2024. ↩
-
EY, International Tax and Transfer Pricing Survey, 2024. ↩
-
OECD, ADIMA database on Multinational Enterprises, 2019. ↩
-
Eurostat, Structure of multinational enterprise groups in the EU, 2022. ↩
-
OECD, ADIMA Database on Multinational Enterprises, 2019. ↩
-
Activant Capital estimates, 2024. ↩
-
Statista, Revenue of the Big Four accounting /audit firms worldwide by function, 2023. ↩
-
Deloitte, EU Public CbCR obligations for EU and Non-EU headquartered multinationals, 2024. ↩
-
EY, Tax and Finance Operations survey, 2023. ↩
-
Thomson Reuters Institute & Tax Executives Institute, State of the Corporate Tax Department, 2024. ↩
-
Bipartisan Policy Center, AI Use in Tax Administration, 2024. ↩
-
Thomson Reuters, Glossary: Global Intangible Low-Taxed Income. ↩
-
US Congress Joint Committee on Taxation, Overview of the Base Erosion and Anti-Abuse Tax: Section 59A, 2019. ↩
-
Activant, Expert Interview, 2024. ↩
-
Thomson Reuters Institute & Tax Executives Institute, State of the Corporate Tax Department, 2024. ↩
-
Thomson Reuters Institute & Tax Executives Institute, State of the Corporate Tax Department, 2024. ↩
Disclaimer: The information contained herein is provided for informational purposes only and should not be construed as investment advice. The opinions, views, forecasts, performance, estimates, etc. expressed herein are subject to change without notice. Certain statements contained herein reflect the subjective views and opinions of Activant. Past performance is not indicative of future results. No representation is made that any investment will or is likely to achieve its objectives. All investments involve risk and may result in loss. This newsletter does not constitute an offer to sell or a solicitation of an offer to buy any security. Activant does not provide tax or legal advice and you are encouraged to seek the advice of a tax or legal professional regarding your individual circumstances.
This content may not under any circumstances be relied upon when making a decision to invest in any fund or investment, including those managed by Activant. Certain information contained in here has been obtained from third-party sources, including from portfolio companies of funds managed by Activant. While taken from sources believed to be reliable, Activant has not independently verified such information and makes no representations about the current or enduring accuracy of the information or its appropriateness for a given situation.
Activant does not solicit or make its services available to the public. The content provided herein may include information regarding past and/or present portfolio companies or investments managed by Activant, its affiliates and/or personnel. References to specific companies are for illustrative purposes only and do not necessarily reflect Activant investments. It should not be assumed that investments made in the future will have similar characteristics. Please see "full list of investments" at activantcapital.com/companies/ for a full list of investments. Any portfolio companies discussed herein should not be assumed to have been profitable. Certain information herein constitutes "forward-looking statements." All forward-looking statements represent only the intent and belief of Activant as of the date such statements were made. None of Activant or any of its affiliates (i) assumes any responsibility for the accuracy and completeness of any forward-looking statements or (ii) undertakes any obligation to disseminate any updates or revisions to any forward-looking statement contained herein to reflect any change in their expectation with regard thereto or any change in events, conditions or circumstances on which any such statement is based. Due to various risks and uncertainties, actual events or results may differ materially from those reflected or contemplated in such forward-looking statements.