March 10, 2026
Global Mega Trends: 2026
Growth in the age of constraint


Defined By Constraint, Shaped by Resilience
For much of the last century, growth was built on abundance. Capital was cheap, supply chains were stable, and efficiency was the dominant principle. Innovation was largely constrained by imagination alone. This foundation is undergoing a systematic shift.
Today’s environment is defined by constraint: geopolitical fragmentation, demographic pressure, infrastructure bottlenecks, and tightening resources. Growth has not vanished altogether, but it is increasingly shaped by resilience rather than momentum.
In this report, we take a step back from short-term noise to explore the foundational forces reshaping the growth landscape and the secular opportunities emerging in 2026. Our goal is not to gaze into the crystal ball, but to identify the systems being rebuilt around resilience, durability and sovereignty.
To understand the next sources of durable compounding, we must first understand the system configurations at the highest level. The macroeconomic environment that once felt like an endless tailwind, defined by cheap capital and globalization, is changing. This new direction tests the durability of growth models built for clearer skies.
We believe four foundational forces are shaping this transition:
1. Sluggish Growth
The macroeconomic tailwinds that once amplified growth are subsiding, and the global economy is entering a period of structurally slower expansion. Over the next five years, global GDP growth is projected to be the slowest in decades.1
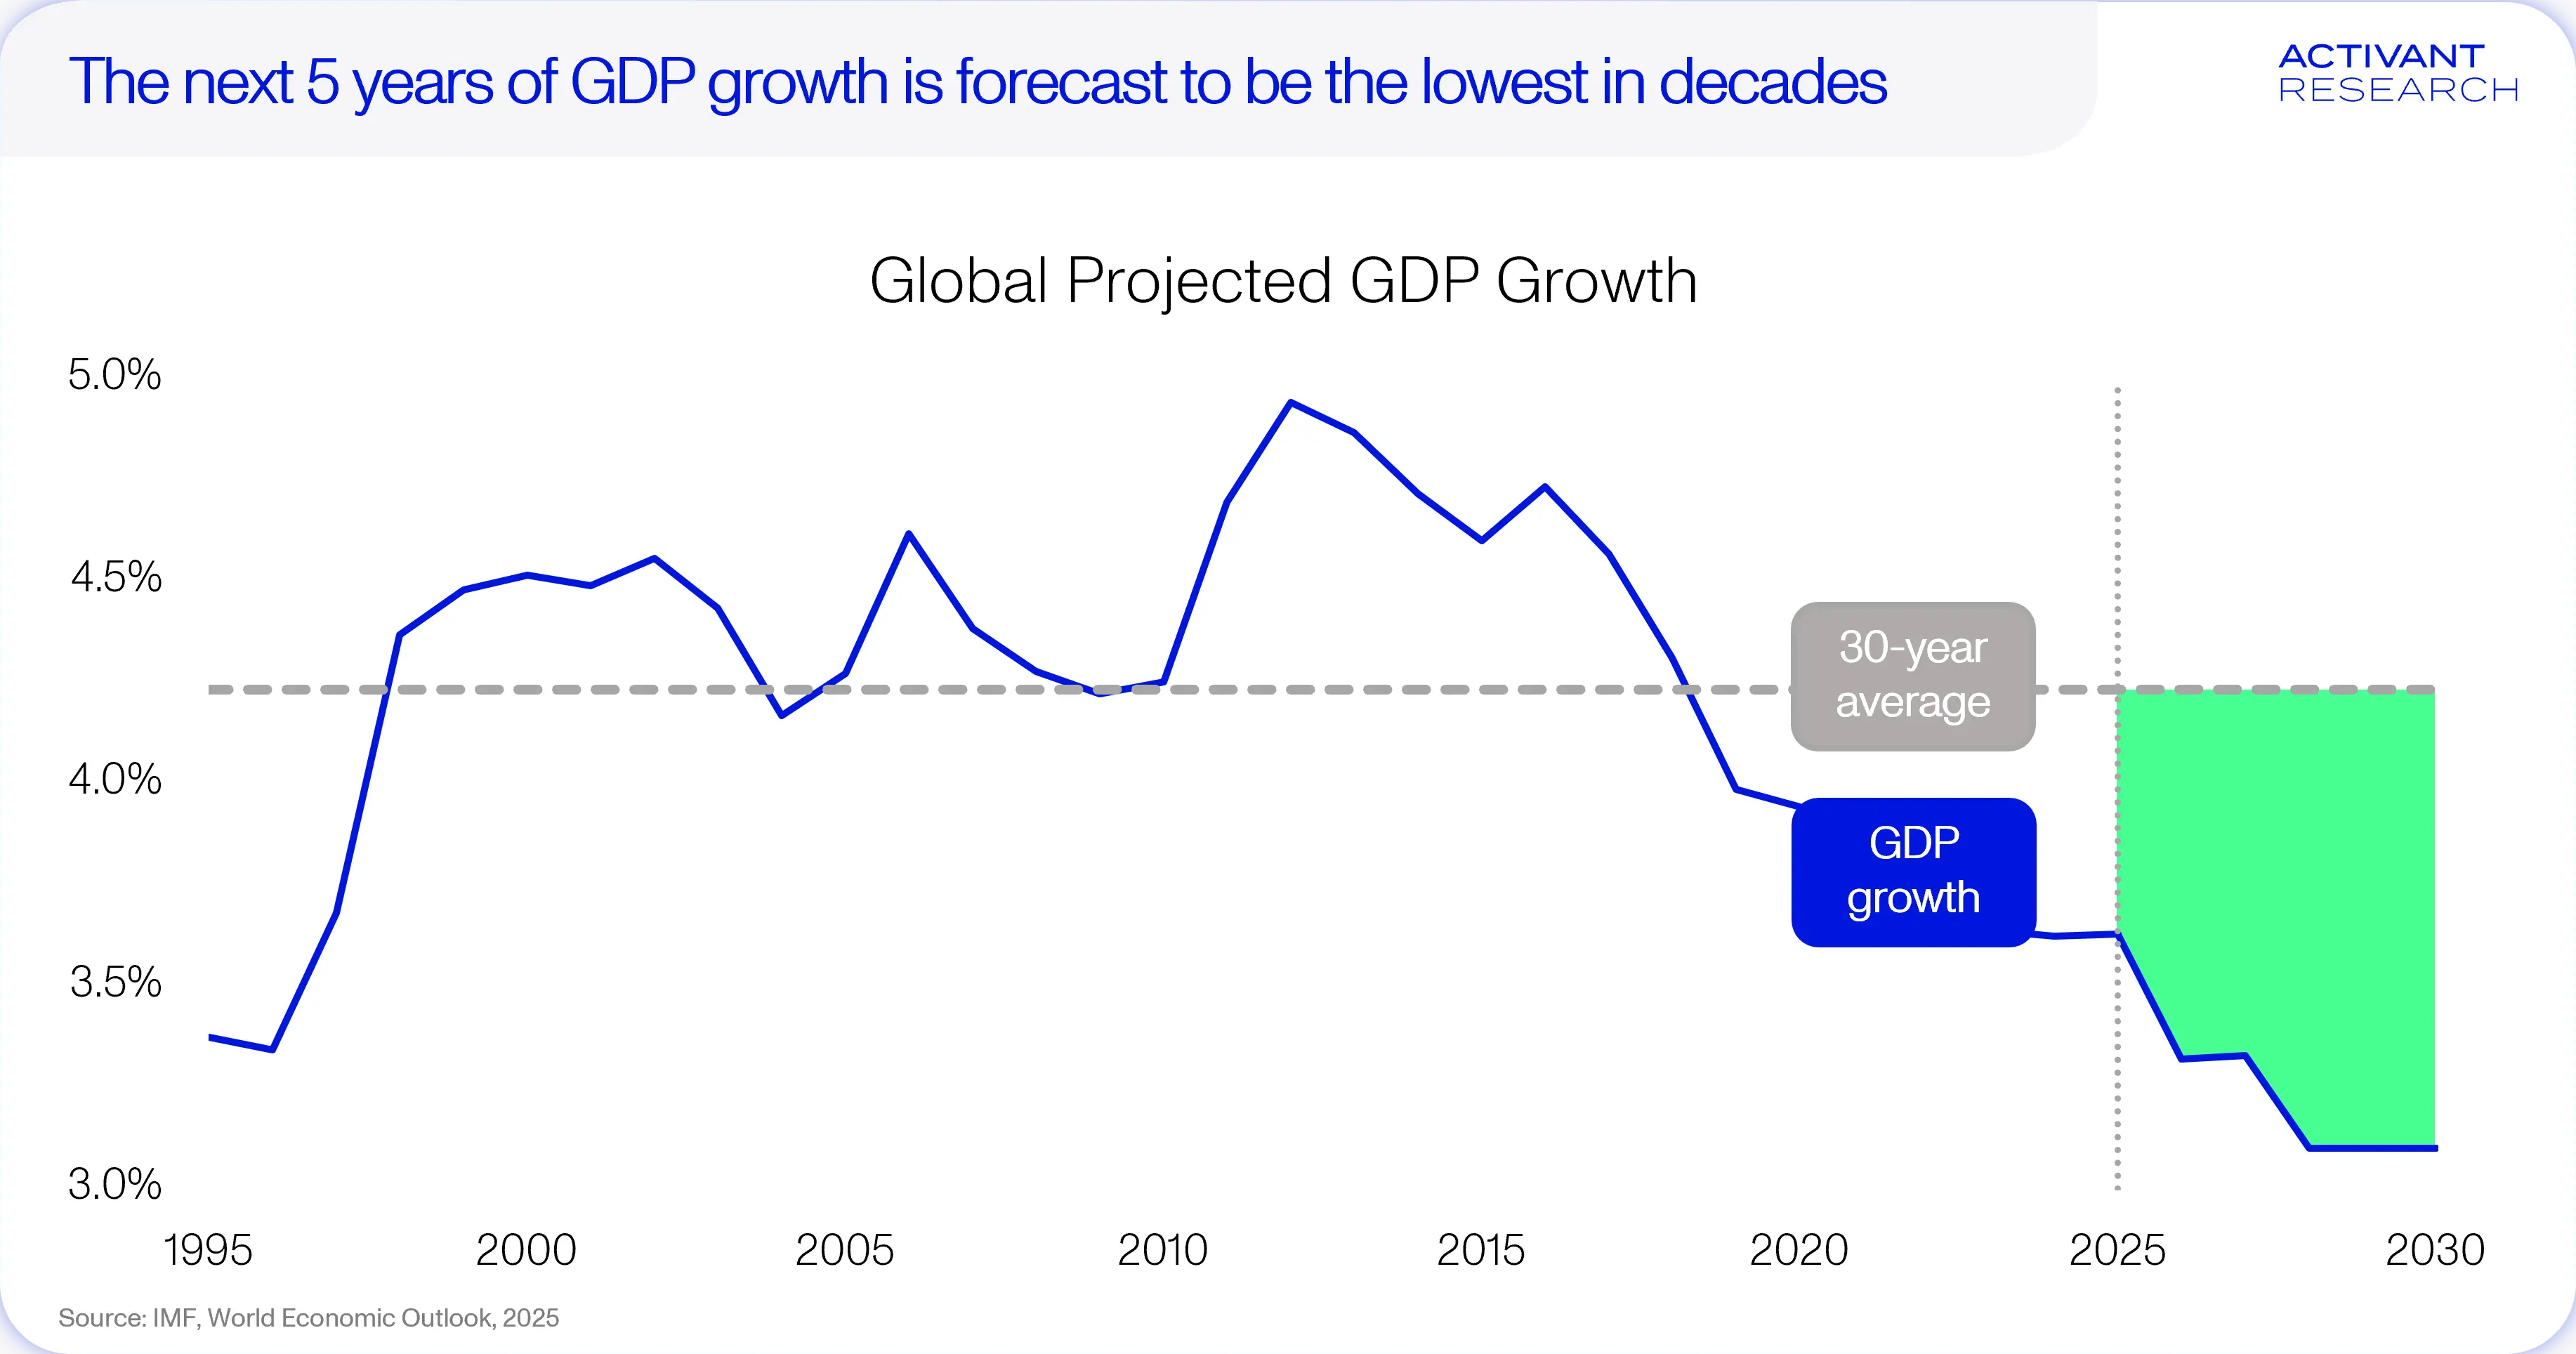
As tailwinds fade and headwinds intensify, capital becomes more selective, and business models become more dependent on operational leverage than momentum alone.
2. Geopolitical Fragmentation & Deglobalization
If sluggish economic growth lowers the ceiling in the house of returns, then geopolitical fragmentation and deglobalization shatters the floor. A century-long era of hyper-globalization and frictionless liberal trade has given way to a new era of economic nationalism defined by weaponized trade policy, protectionism, and lingering fears of war.
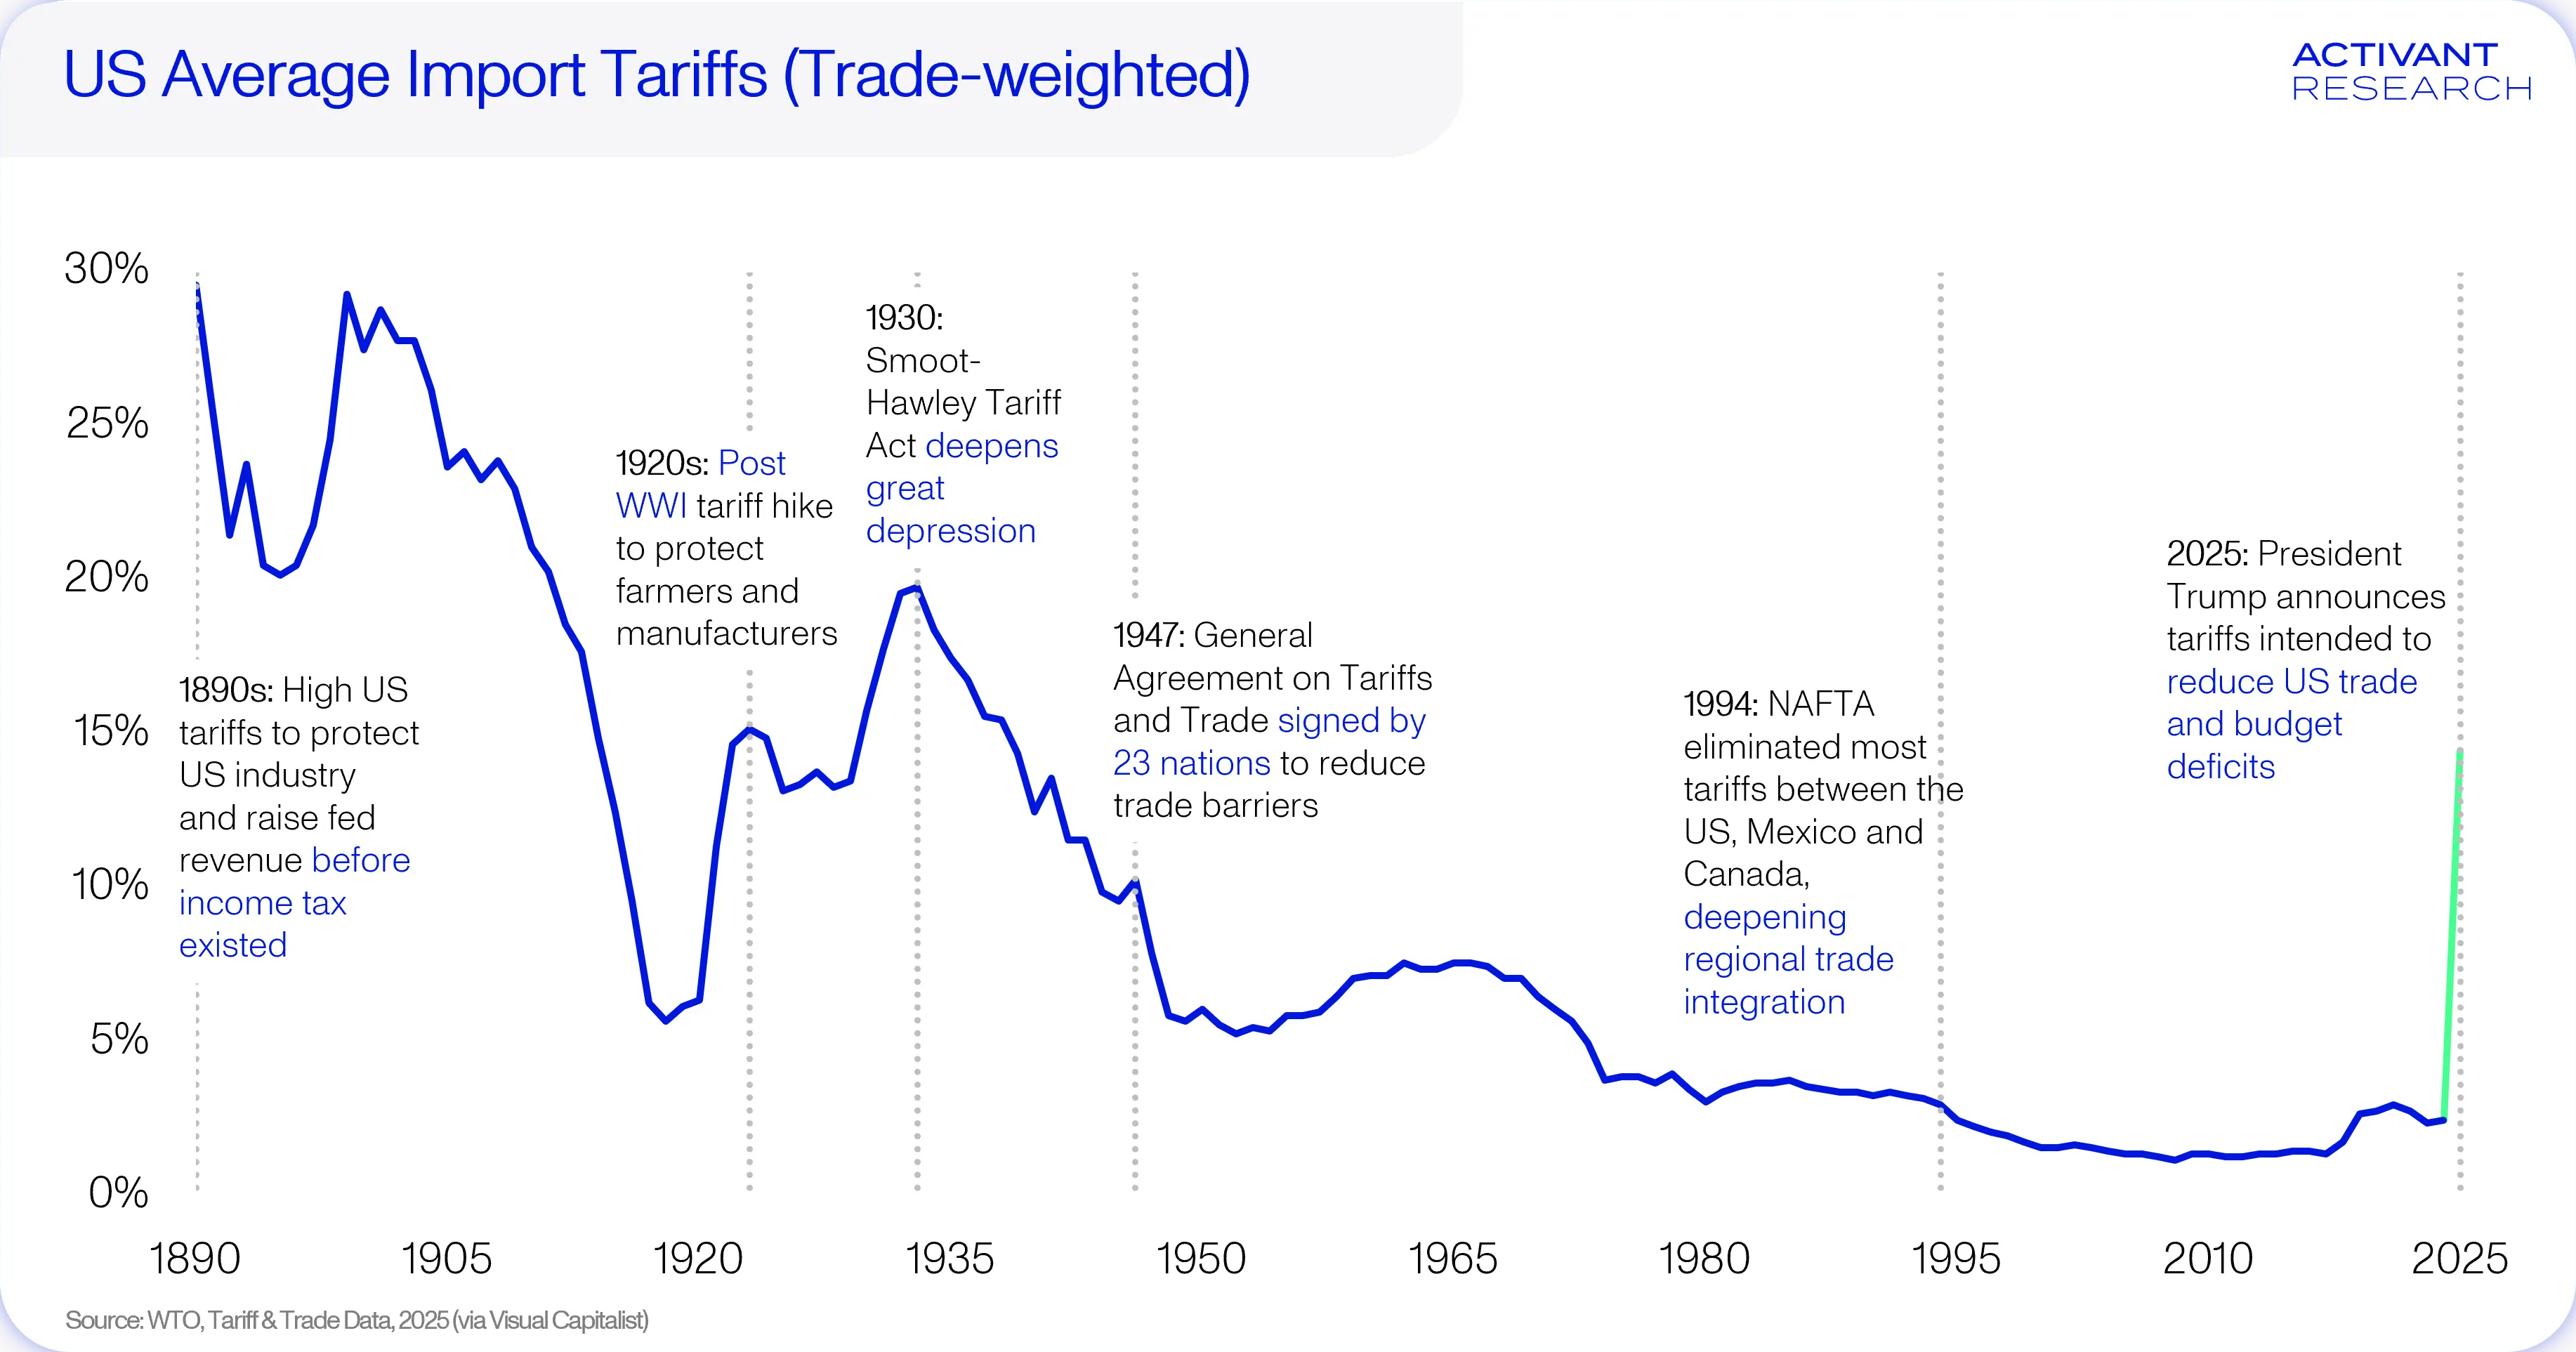
As a result of weaponized trade policies, we’re seeing a bifurcation of global trade where countries are routing trade to their friends rather than their foes. Since 2019, West-aligned economies have predominantly directed capital inward, boosting intra-bloc investment by ~47%, while investment into East-aligned markets has dropped by more than 60%.2 The Russia-Ukraine war woke Europe to the fact that these global competitions could turn hot, sparking a defense spending-spree. In 2023, only about a quarter of NATO members exceeded the 2%-of-GDP defense spending benchmark; by 2025, every member had surpassed it.3 NATO has since committed to raising this threshold to 5% by 2035, driving the perception that we are in the middle of a shift from post-war to pre-war economics.
As a result, we’re pivoting to a world where resilience and security become the primary decision-making vectors for economic design, and we see that as a far-reaching mega trend that will shape the coming decade.
3. Shifting Demographics
Developed economies are undergoing a demographic shift as the long tail of the baby boom era recedes. Global populations are aging. Rapidly. There are two primary tailwinds underpinning this transition:
a) Declining fertility rates: women are having fewer children, especially in developed economies, reducing the number of young people entering the population every year.
b) Advances in healthcare and living standards: modern medicine and care environments are extending lifespans, particularly among infants and the elderly.
As nations develop and urbanize, their demographics are increasingly defined by lower birth and death rates. Basically, fewer births + longer lives = an aging population.
This will have profound effects on global economic models as old age dependency rates increase worldwide. World Health Organization data shows a persistent increase in old-age dependency (the elderly population as a % of the working population) since the mid-2000s. In 2020, the number of people aged 60 years and older outnumbered children under the age of five for the first time ever.4
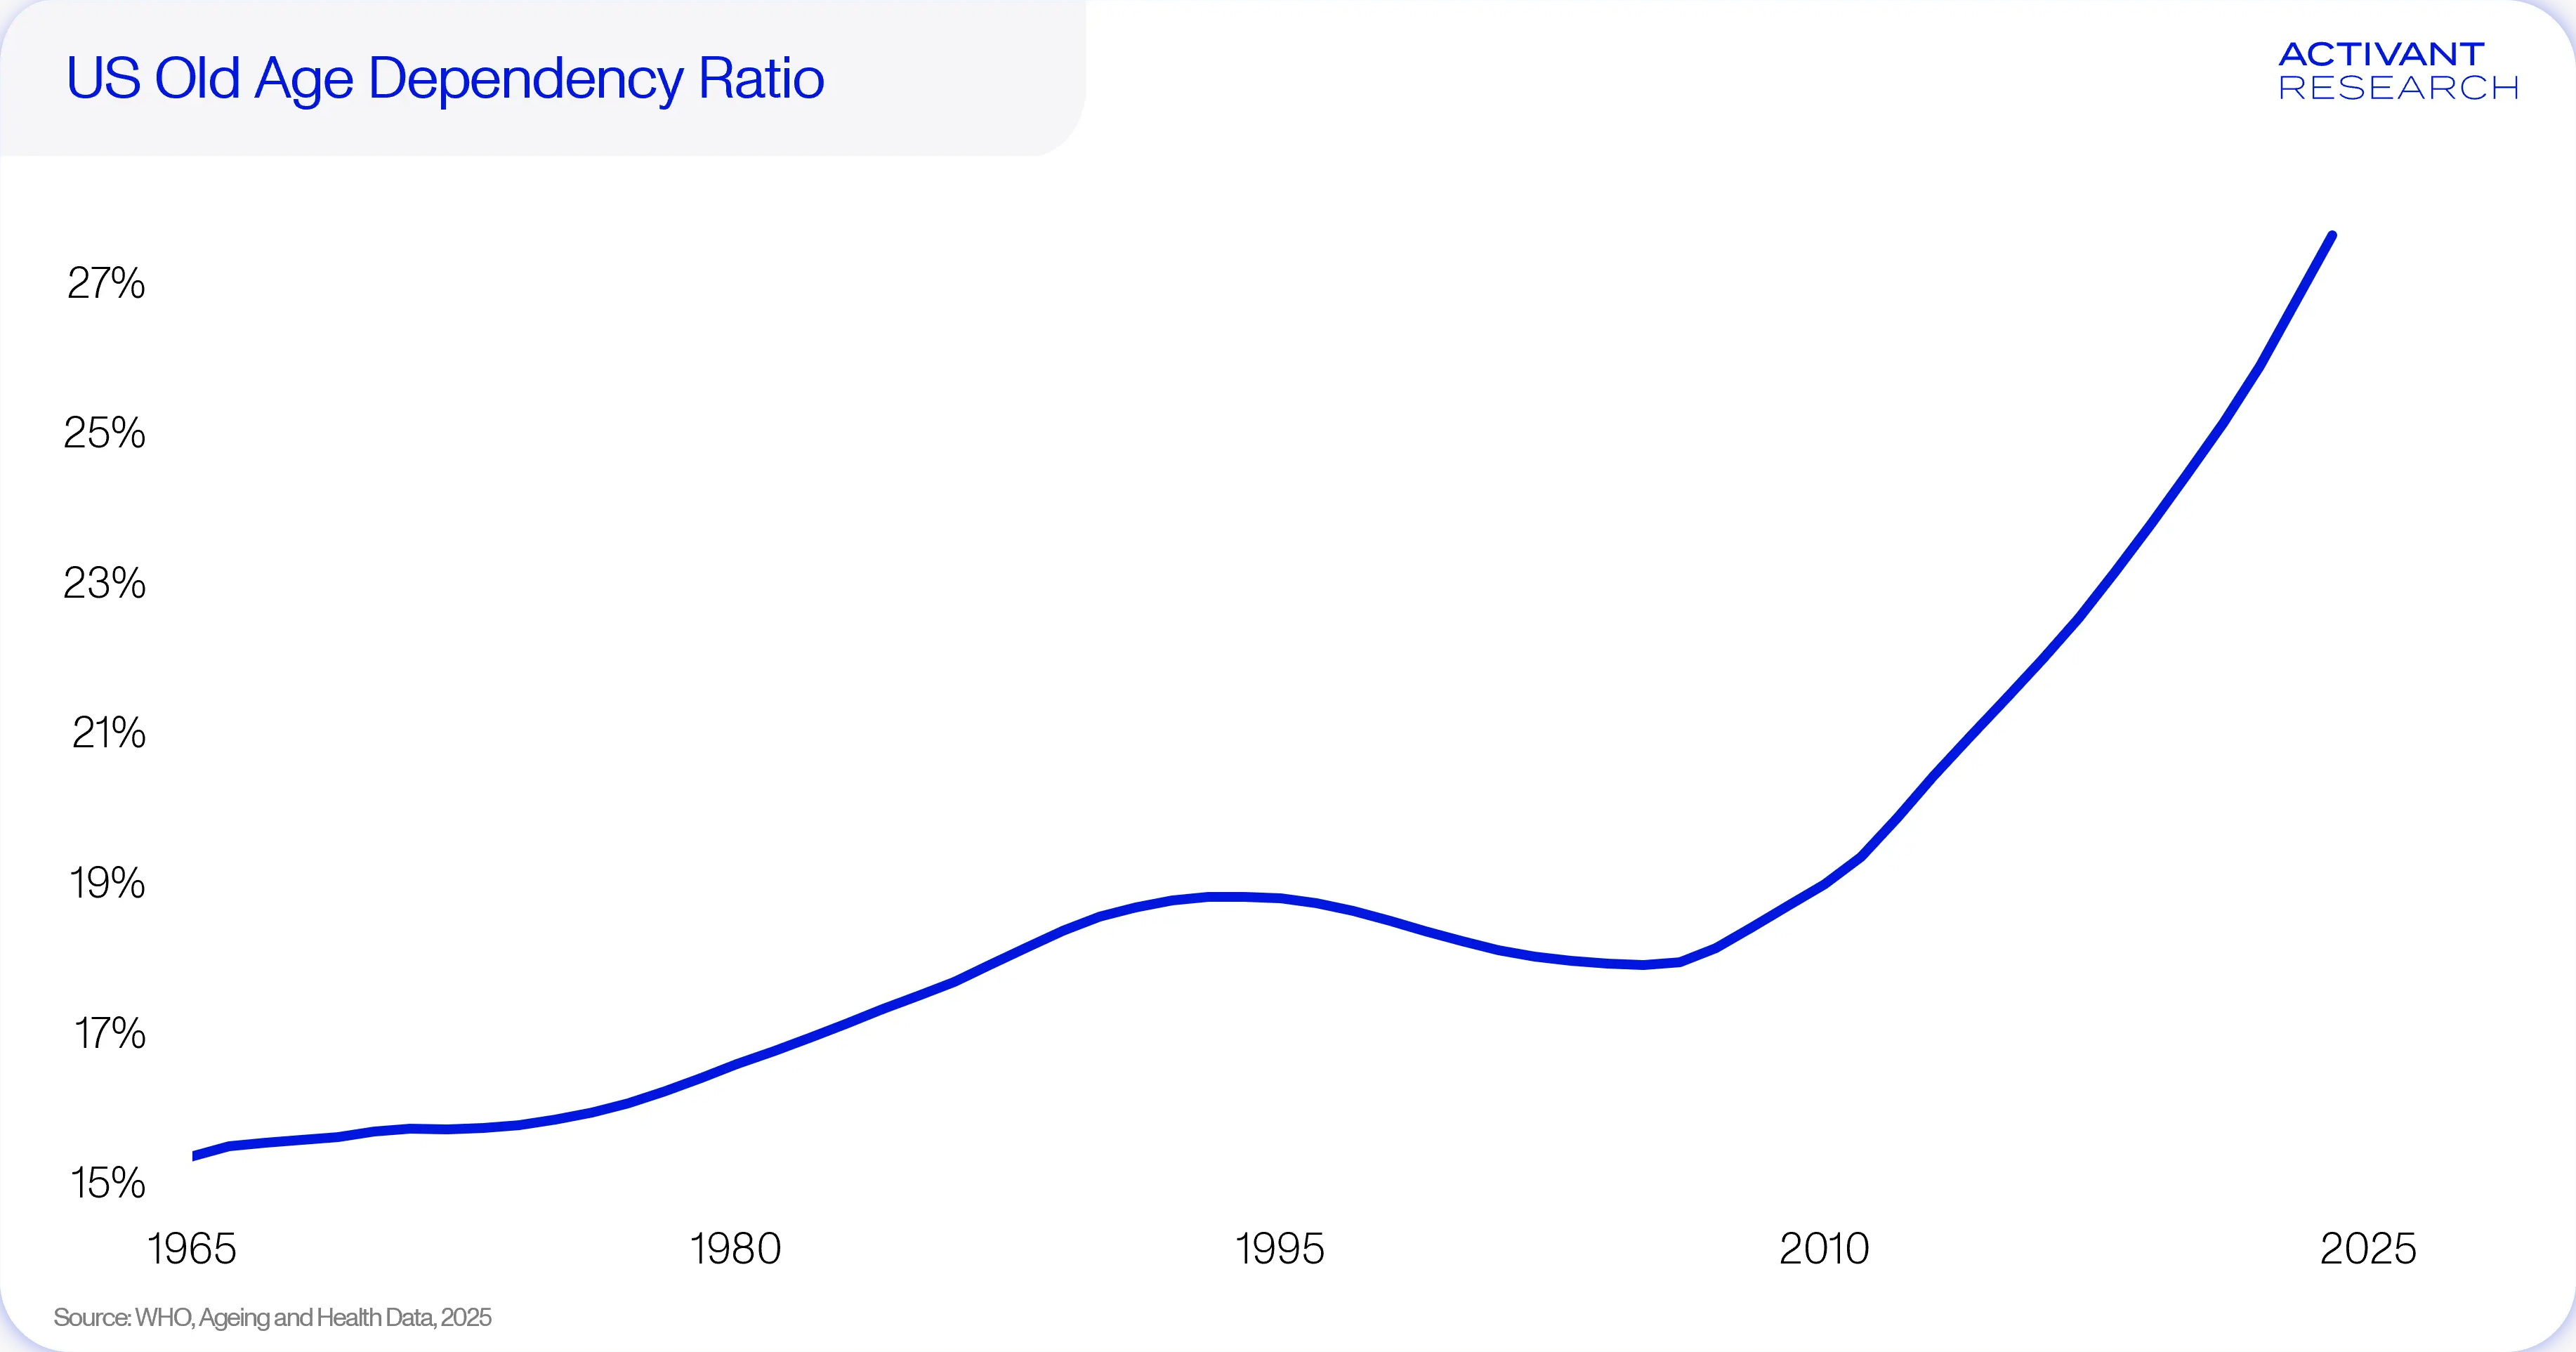
An aging population carries higher, more diverse care needs. This is driving innovations across healthcare and biotech as investment into personal longevity compounds. In the U.S., the 65+ age bracket currently represents roughly 17% of the population but spends 37% of all healthcare dollars. By 2030, this cohort is expected to comprise 20% of the U.S. population, contributing to a healthcare labor shortfall of ~10 million workers, with 42 out of 50 states already experiencing serious labor gaps.5
Beyond healthcare, there is a massive need for workforce automation across all sectors, as population aging creates labor constraints around the world.
The aging U.S. population is also expected to create one of the biggest transfers of wealth in history. Adequately dubbed “the great wealth transfer”, it is expected that by 2048, ~$100 trillion will be inherited by Gen X, Millennials and Gen Z in the U.S.6 This will reshape financial markets and disrupt the traditional wealth management model, forcing it to adapt to a younger generation with different priorities.
4. The Rise of AI
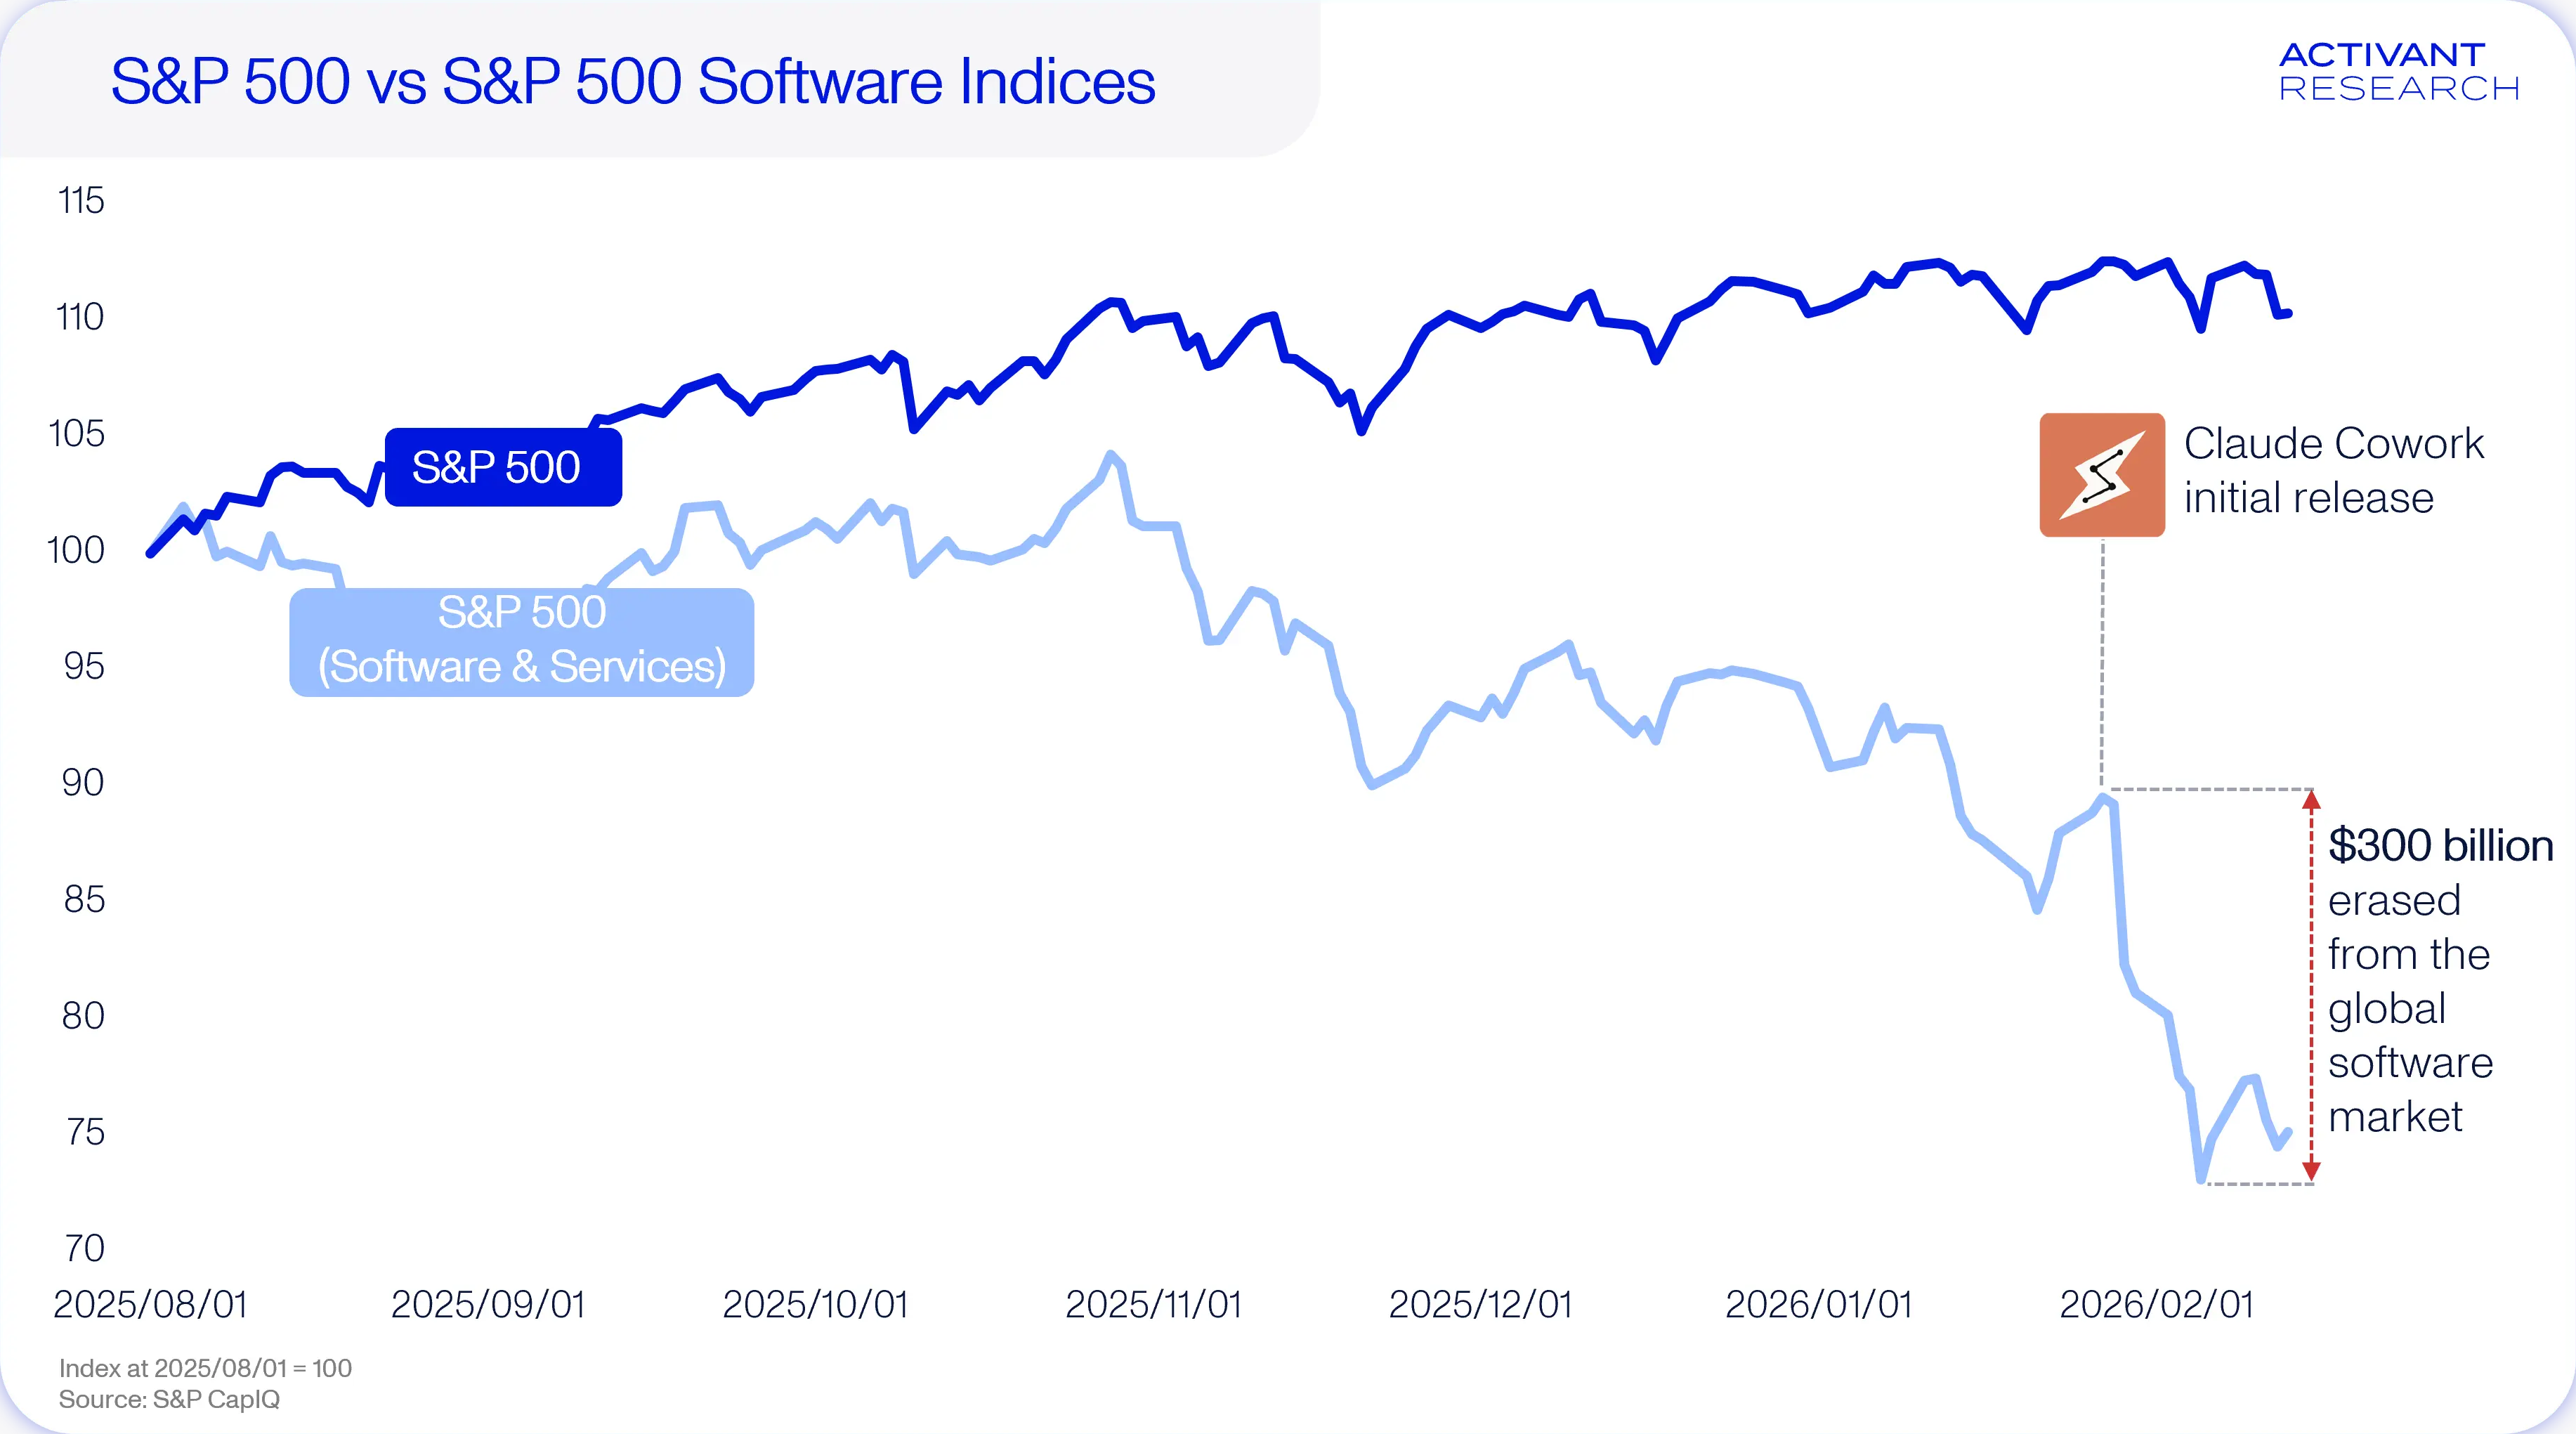
Sluggish economic growth, geopolitical fragmentation, and the demographic shift are all taking place as AI promises to fundamentally reshape our world. An AI-fueled productivity wave could boost U.S. GDP growth to 3% by 2034, which is significantly higher than the 1.7% predicted under the baseline scenario.7
We are still early into this transition though. In 2025, only 20% of enterprises deployed AI across five or more business functions.8 By 2035, agentic AI is expected to drive 30% (or $450 billion) of enterprise application software revenue, up from 2% in 2025.9 Agentic AI is poised to completely rewrite the enterprise software rulebook as we know it, and public markets are already pricing this in.
To keep up with AI-driven demand, global data center capacity needs to scale from roughly 74 GW today to 230 GW in 2030.10 This massive infrastructure buildout will place unprecedented strain on power grids. Historically, growth was constrained by the availability of compute; now, access to reliable electricity is the limiting factor. Up to 20% of the global data center capacity planned for 2030 could be delayed due to grid constraints.11 Grid upgrades are notoriously prolonged processes, often with ~10-year project timelines.12
As access to compute becomes dependent on access to power, infrastructure ceases to be a neutral utility and becomes a strategic asset. The defining question is no longer who can build the best models, but who controls the stack required to run them.
Technology Sovereignty
The rise of AI, combined with increasing geopolitical pressure, is accelerating a new strategic priority: tech sovereignty — the ability to own, and control the underlying technology stack.

Semiconductors underpin all of technology and are now a critical global commodity, often treated as a de facto currency in geopolitics. Much like oil in the 20th century, advanced chips are central to national security, AI leadership, and industrial power. Today, advanced semiconductor foundry capacity is heavily concentrated in East Asia, with the U.S. controlling only 12% of global foundry capacity.13
Tech sovereignty also sharpens focus on AI governance and related cyber security risks. Since the launch of ChatGPT in 2022, the number of AI-driven cyber incidents have increased by 50% YoY, elevating the urgency for stronger AI governance.14 In the U.S., more than 1,000 AI-related state-level bills were proposed in 2025; however, only ~10-11% of these were actually enacted into law.15 Regulation is growing but adoption remains cautious and focused on targeted, specific issues rather than sweeping regulations.
From a geopolitical perspective, state-sponsored hacks are also becoming harder to detect. Russian cyber-attacks against NATO states increased by roughly 25% in 2025,16 yet data from the CSIS Significant Cyber Incidents Database shows a progressive decline in significant cyber-attacks (where damages exceed $1 million) since 2020. State-sponsored attacks are now prioritizing non-financial gains and long-dwell espionage.
In a fragmented world, tech sovereignty is no longer optional. Control over critical technologies is becoming the source of resilience and a robust, durable advantage.
Secular Trends Shaping the Opportunity Landscape
Every shift creates new whitespace. If constraint defines the canvas and sovereignty shapes the design, then capital must flow toward the systems that build resilience. We see five secular trends that will play a defining role in shaping the growth opportunity landscape in 2026 and beyond.
A. AI Infrastructure Development
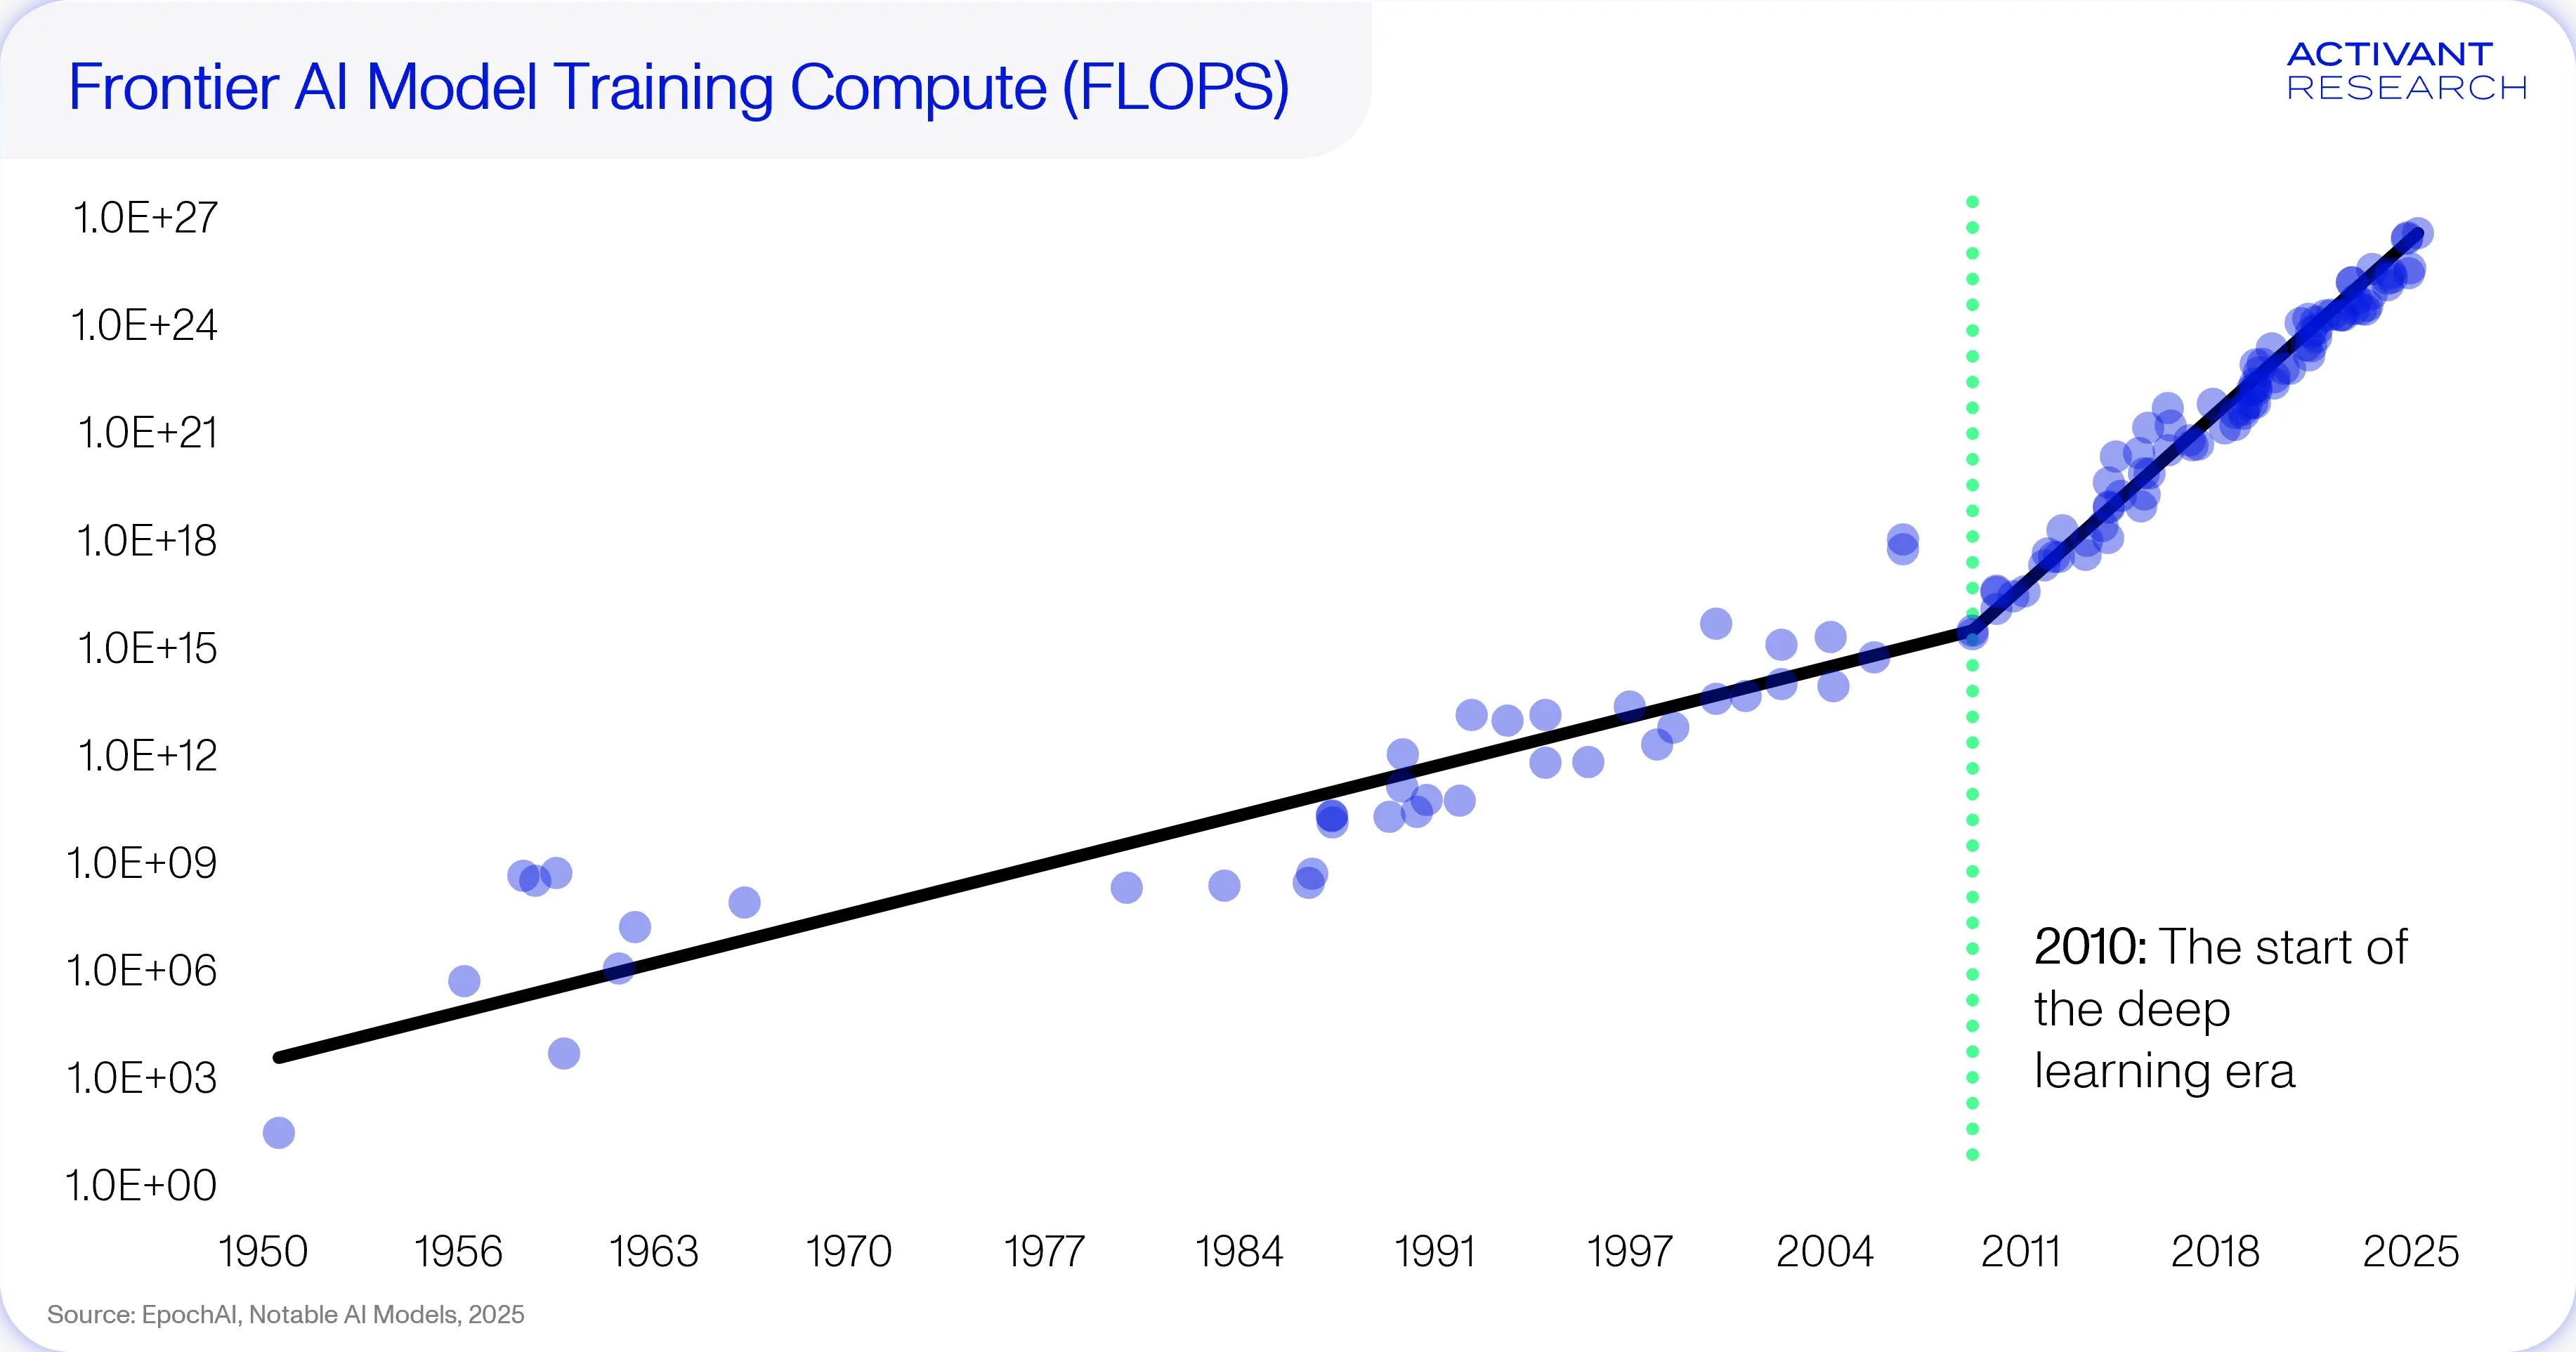
Modern AI is fundamentally driven by the scaling laws: larger models, trained on more data and powered by greater compute, consistently deliver better performance.17 Adherence to these scaling laws has sparked a new phase of hypergrowth in AI infrastructure, creating an urgent need for sustained investment across the hardware stack to support the next decade of AI deployment at scale. Since the proliferation of deep neural networks in 2010, compute requirements for frontier AI models have grown 13x YoY.18
With compute comes capability, and the biggest beneficiary of improving model capability across the AI stack is the application layer. Thousands of vertical-specific AI applications (agents) have emerged, driving rapid growth. In 2025, this new wave of AI-native startups grew from $5 billion to $47 billion in ARR.19 As a result, the application layer has attracted more than double the deal flow of any other segment across the AI stack.20
Models are also becoming cheaper to use, and Jevon’s Paradox holds true: total consumption rapidly increases as usage explodes. This has kicked off a historic capex boom, with hyperscalers spending ~$300-400 billion on AI infrastructure in 2025 alone.21 The evolution of AI is inherently self-reinforcing. Growing data volumes enable better models, and better models driver broader AI adoption, producing even more data and accelerating the cycle.
AI runs on compute, but compute runs on electrons, and the grid is the hardest thing to scale.
B. Electrification Imperative
What starts as a data-and-model flywheel quickly becomes an electricity story. The next build cycle is a race for electrons, and AI is the biggest driver.
When Nvidia’s Rubin-era GPUs are released in 3Q26, a frontier AI server will have a rack-level power consumption of ~200kW. This is a 20x increase in power consumption from the state-of-the-art servers in 2020. Rack-level power consumption is expected to move north of 600kW when the Rubin Ultra range of GPUs is released in 2027.22
Beyond AI, electrification is showing up most visibly in mobility through surging electric vehicle (EV) adoption. Globally, EV sales have increased tenfold since 2019, driven most notably by demand in China. A quarter of all cars sold in 2025 were EVs, 71% of which were manufactured in China.23 The overarching trend is global though and greater EV penetration directly results in durable load growth.
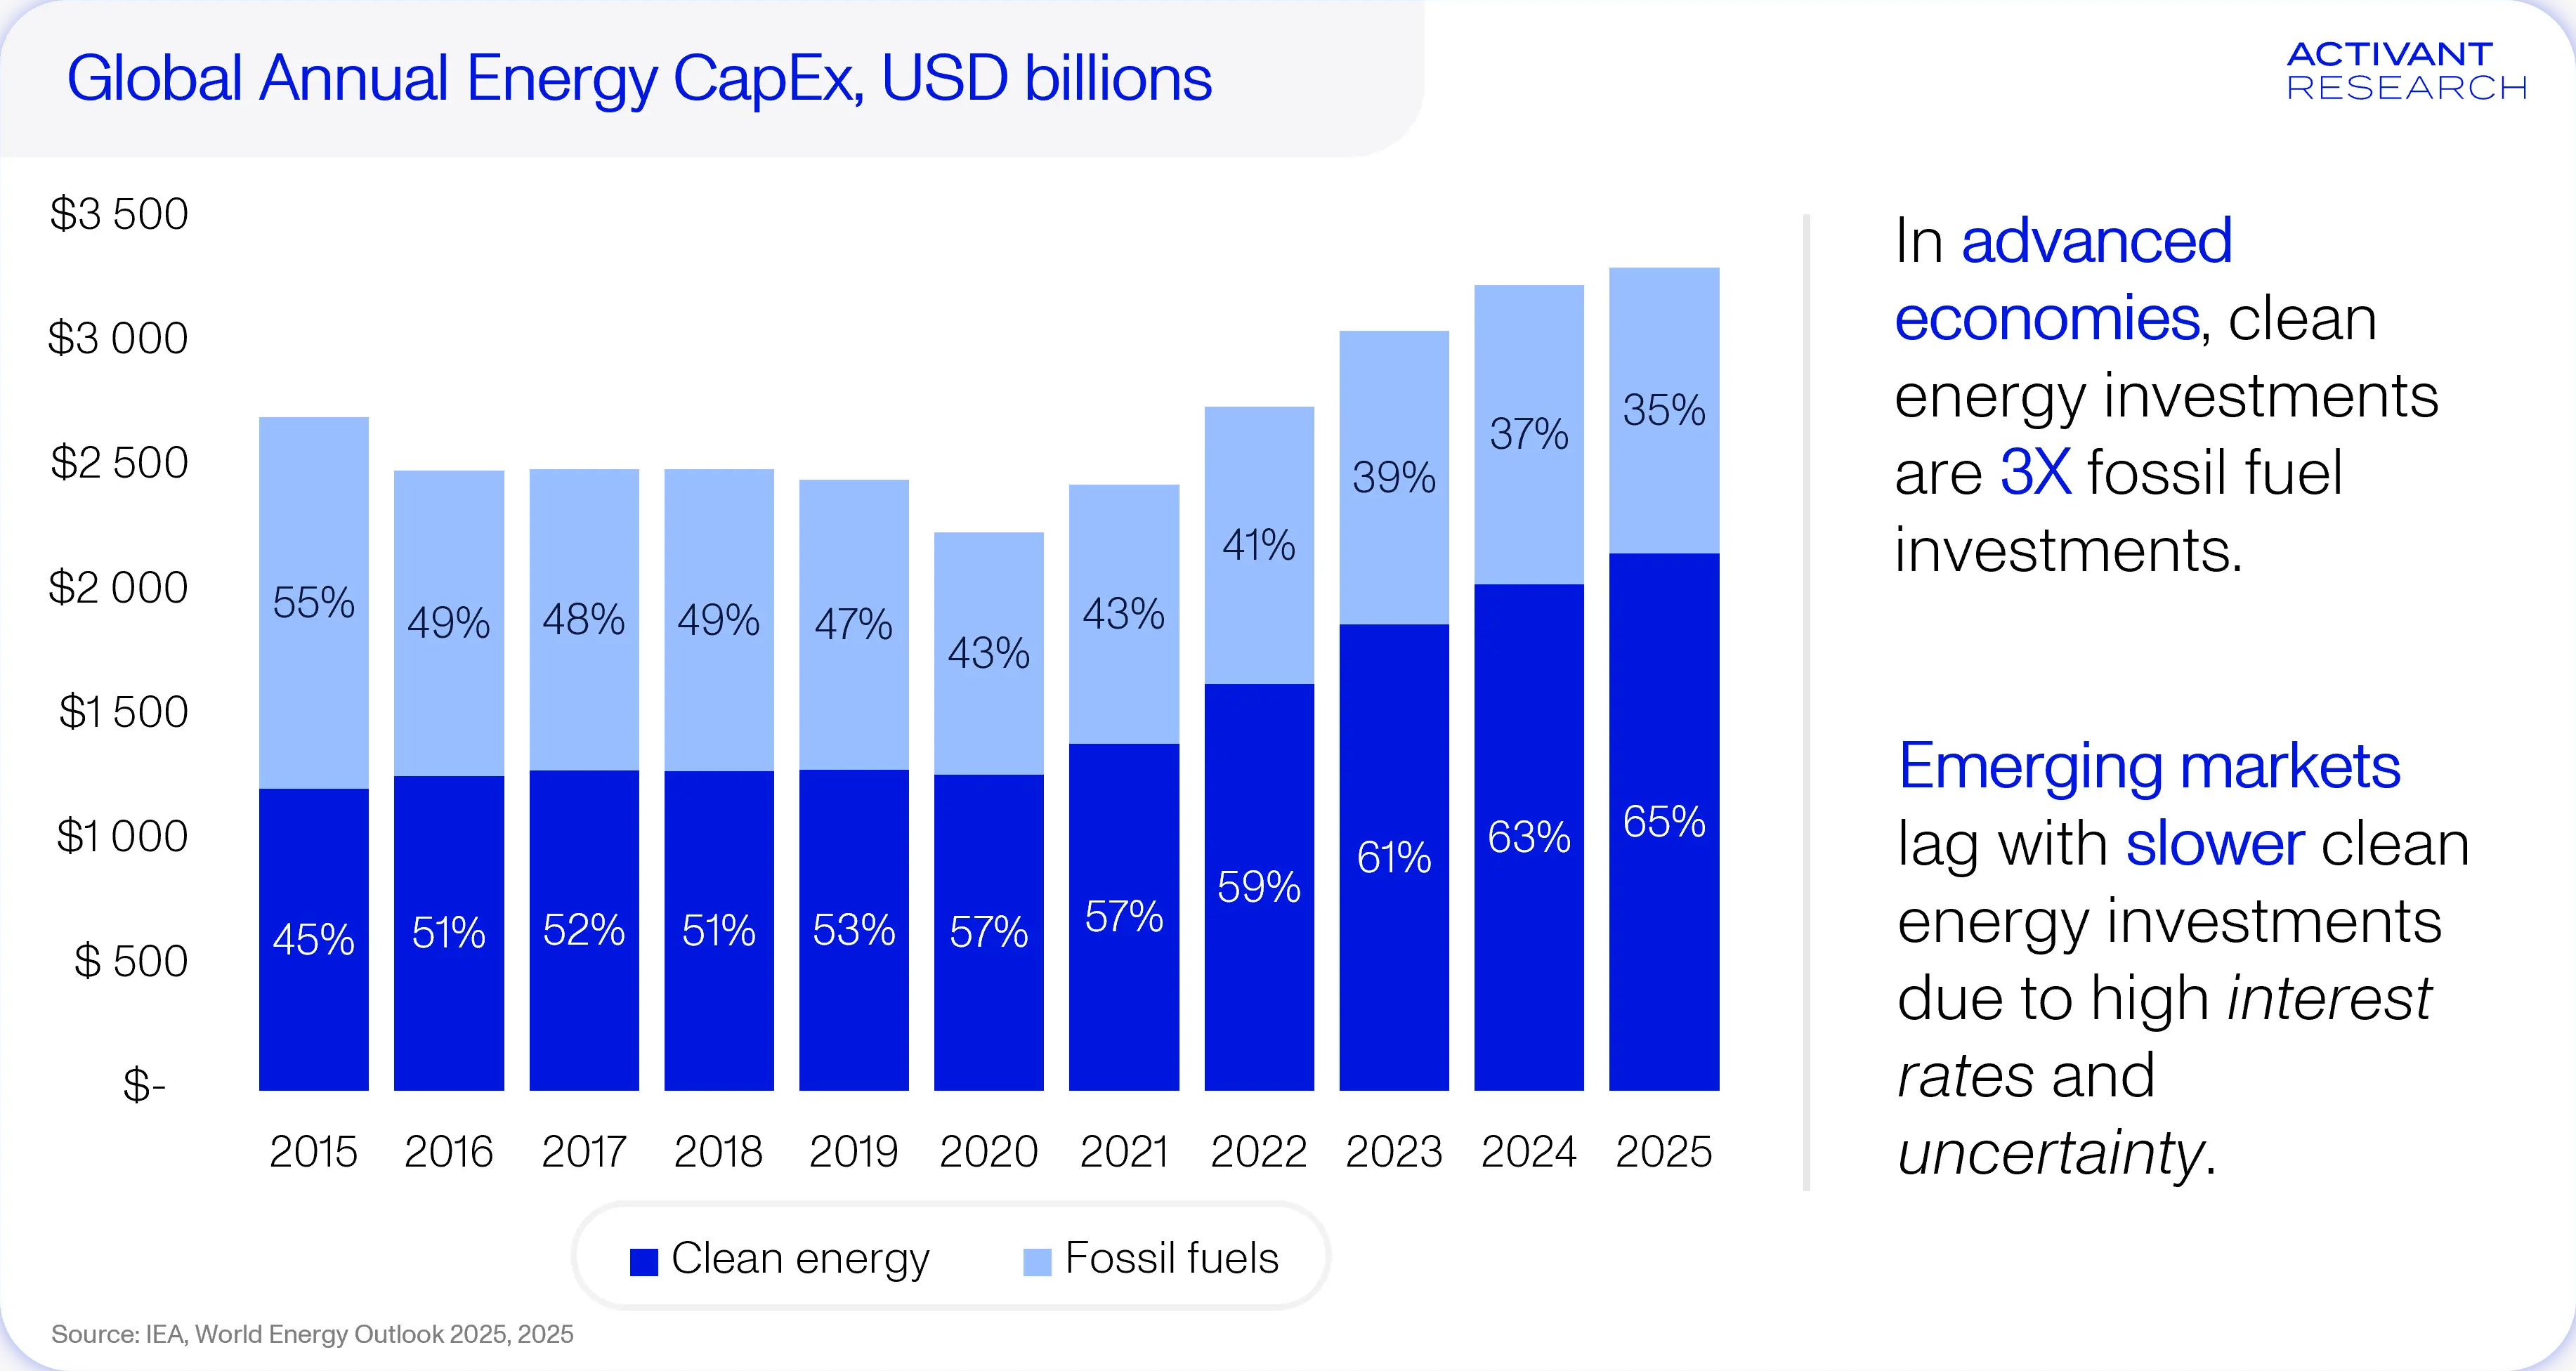
Electricity consumption in the U.S. has been relatively stable for the last two decades, but this is about to change. AI-driven data center expansion, broad-based electrification, and supply chain regionalization are predicted to drive a 40% growth in electricity demand by 2034.24 Globally, electricity supply lags demand, and electricity price inflation has proven to be sticky. As electricity prices rise, capital is increasingly flowing toward clean power supply and grid investment. Since 2021, global annual clean energy capex has grown at 12% CAGR, compared to just 3% for fossil fuel capex.25
Clean energy investment is rising, but the underlying goal is broader: resilience and security across critical infrastructure.
C. Importance of Resilience
The driving force of the global economy is digital, but it runs on physical foundations. Every AI inference consumes electricity. Every data center requires water for cooling (not to mention the copious amounts of energy). Every advanced semiconductor is made up of silicon and rare earth minerals. Every battery depends on lithium, nickel and copper. These dependencies, once obscured by abundant supply and weaker demand, are now emerging as binding constraints.
Energy and water security, critical material availability and grid capacity are becoming structural bottlenecks. Renewable energy has transcended its reputation as a sustainability initiative; it is now an economic and geopolitical rationality. Not only is investment in renewables projects a way to reduce exposure to volatile fossil fuels prices, but it is also the best way for nations to invest in energy sovereignty. Today, 91% of renewables projects are cheaper than fossil fuel alternatives, and since 2010 they have saved more than $1.3 trillion from avoided fossil fuel import costs.2627 Security, resilience and cost imperatives are driving widespread adoption, and capacity is expected to double by 2030.
Energy storage has been a critical enabler. Battery technology has helped transform renewables from an expensive, intermittent alternative into a reliable and economically sustainable power source. Energy storage costs have dropped by almost 93% since 2010 on a $/kWh basis.28 Renewable energy sources + cheap storage = always-available power.
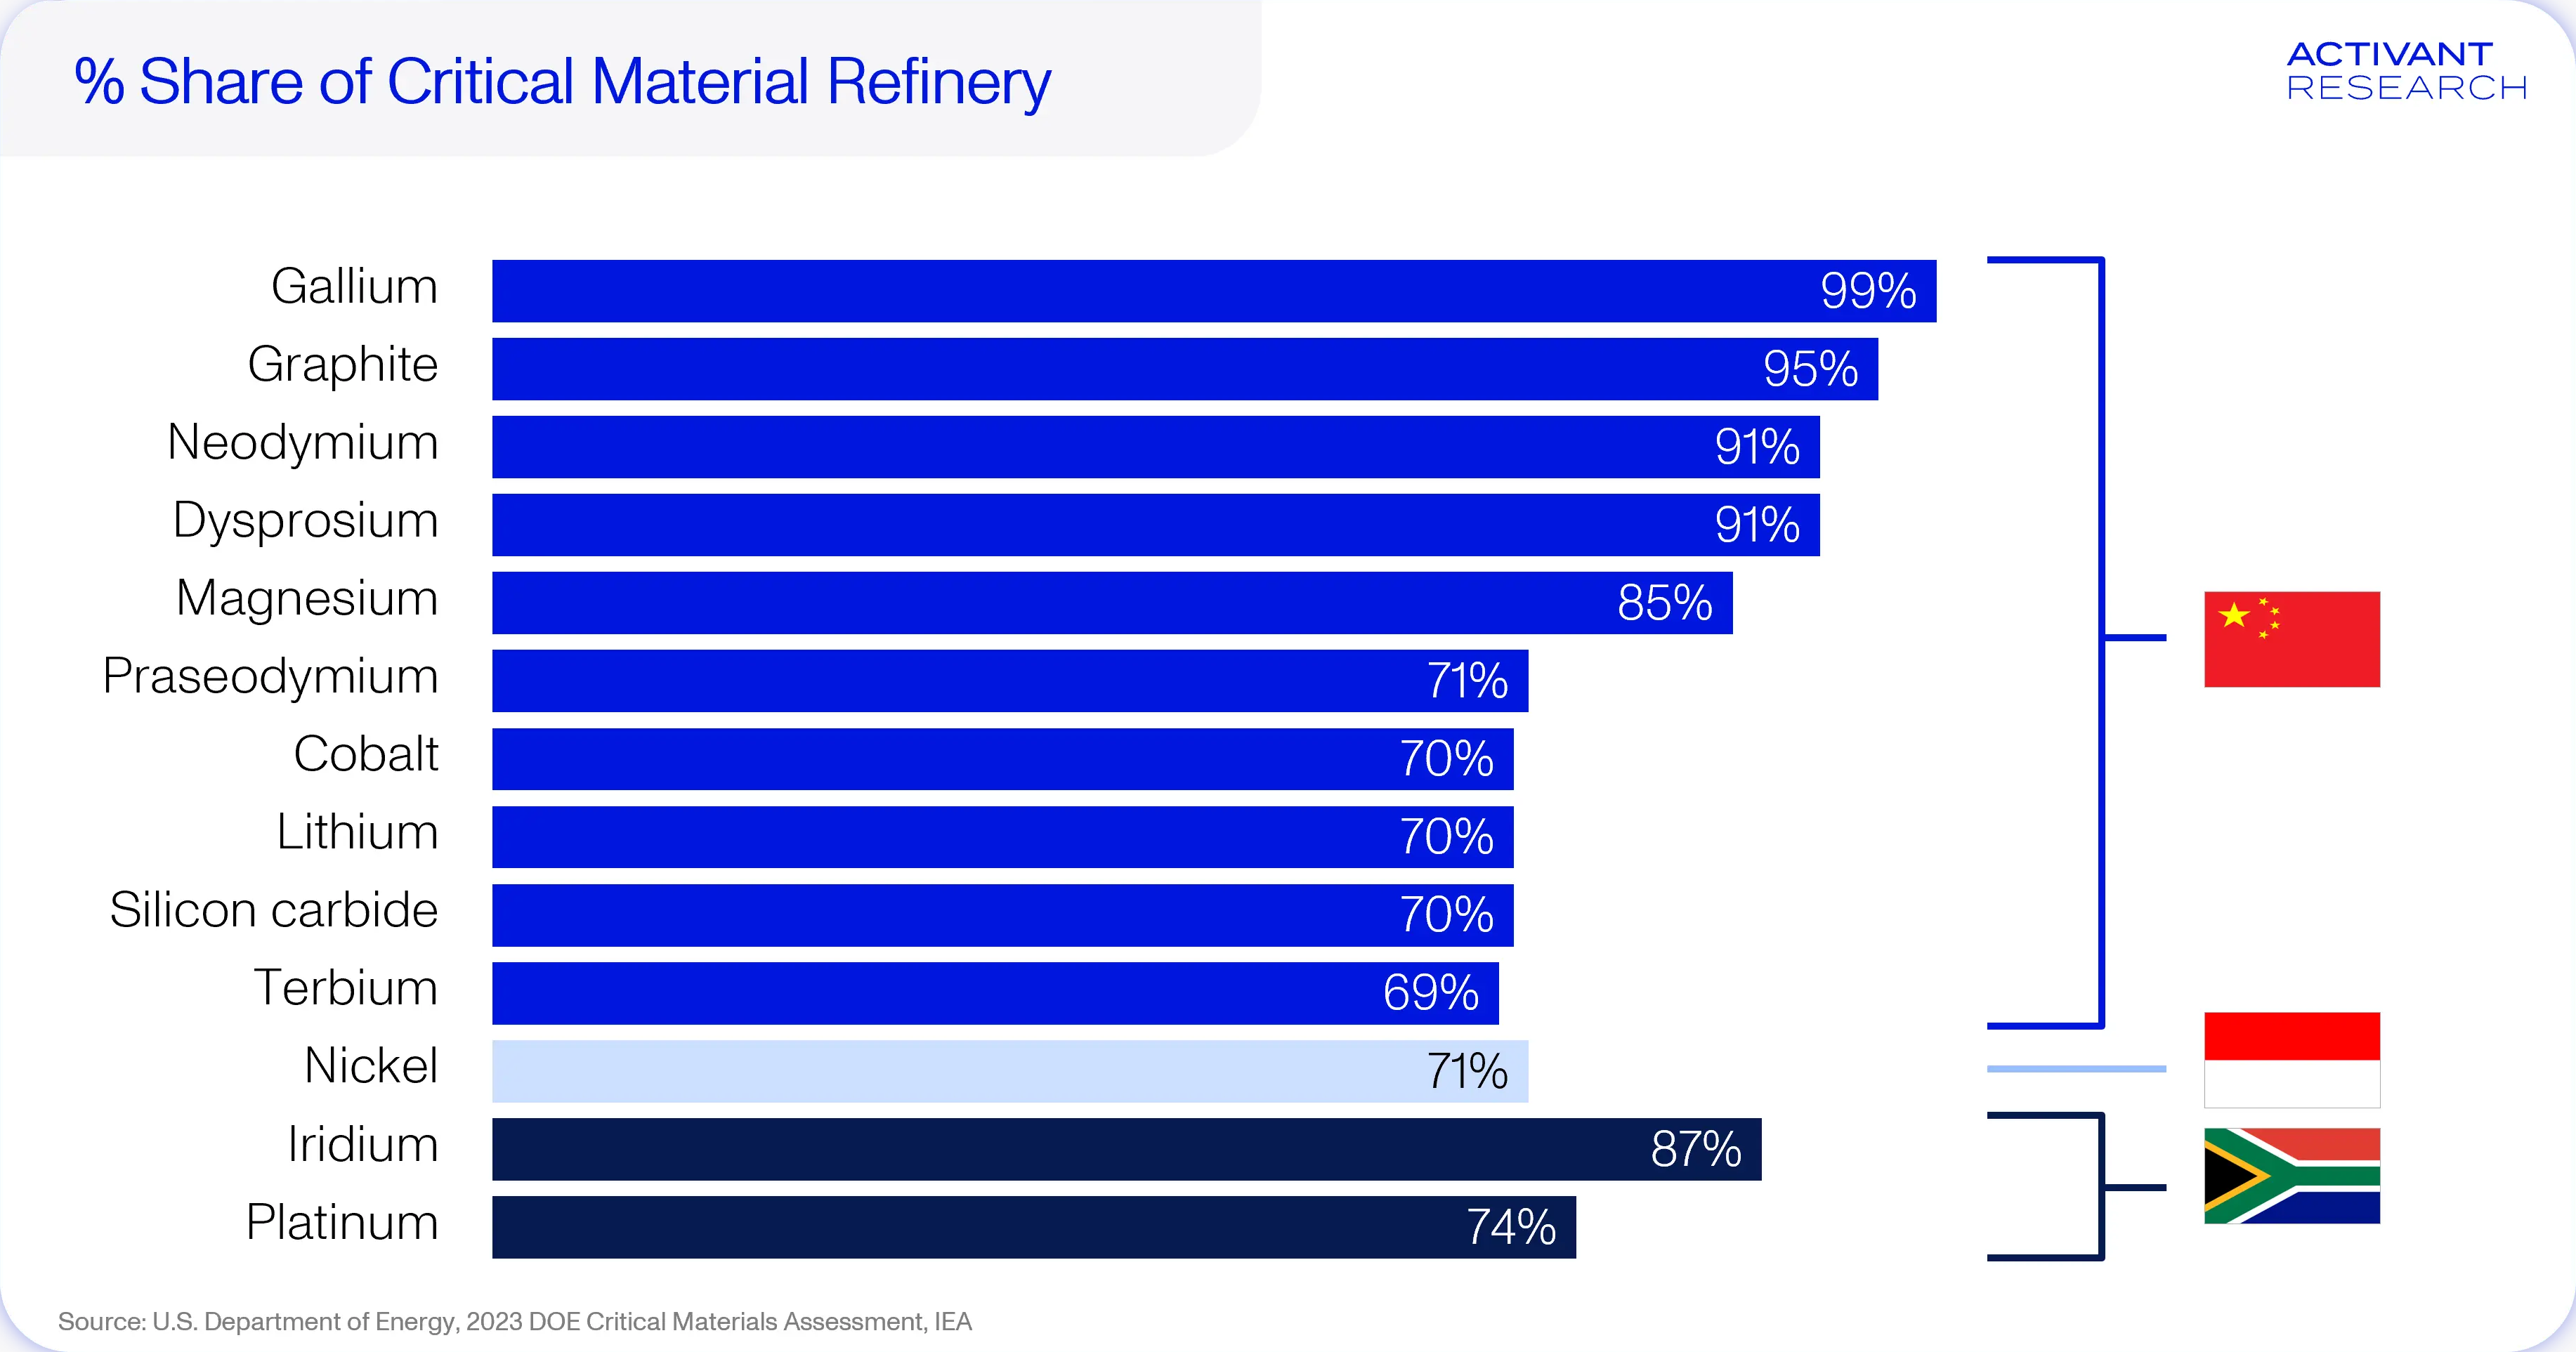
The next critical step is modernizing the grid itself. AI-driven prediction, optimization, and simulation reduce cost curves and improve grid flexibility. Smart grid software could unlock as much as 10x the capacity by mitigating the effects of interruptions in distributed electricity networks.29 However, more intelligent grids are also more materials-intensive. Yes, software is the enabler, but grid transformation is deeply rooted in physical supply chains. The raw critical materials that energy innovations depend on are widely distributed and abundant, but the capacity to refine these materials is not. China dominates global refinery capacity for rare earth metals and other energy-critical materials.30 The West has massive deposits of raw critical materials but lacks the infrastructure to refine them. New processing hubs will be the equivalent of 19th-century oil refineries.
Typically, there are three ways a nation can get their hands on refined critical materials:
- Long-term strategic trade partnerships with refinery-enabled nations (of which there are very few)
- Investment in domestic refinery capacity
- Recovery from secondary sources
Critical materials recovery was once a niche opportunity; now, it is an imperative. The concentration and escalating demand of refined critical materials positions the recovery market for 20x growth by 2046.31 Circularity has become a hard economic necessity and a means to build resilience.
Grids can be modernized, rare earth metals can be recycled, and supply chains can be redesigned, but true economic resilience hinges on a single resource— water. The largest capital allocations of the next decade assume that water availability is a guarantee, but is this a valid assumption? The World Economic Forum estimates a $7.5 trillion water financing gap by 2040, requiring investment across infrastructure, circularity, innovation and access.32
As capital flows toward reinforcing physical systems, an equally important shift is underway inside factories, warehouses, hospitals and even our own homes: redesigning processes to operate with fewer fragile human and material inputs.
D. Rise of Robotics
Building resilience increasingly means reducing reliance on scarcity and fragile processes. It is as much about redundancy as it is about automation. Intelligent software is constantly becoming more capable, hardware is becoming more accessible, and labor is becoming more expensive. The stage is set for general-purpose robotics to finally escape the lab and enter large-scale production.
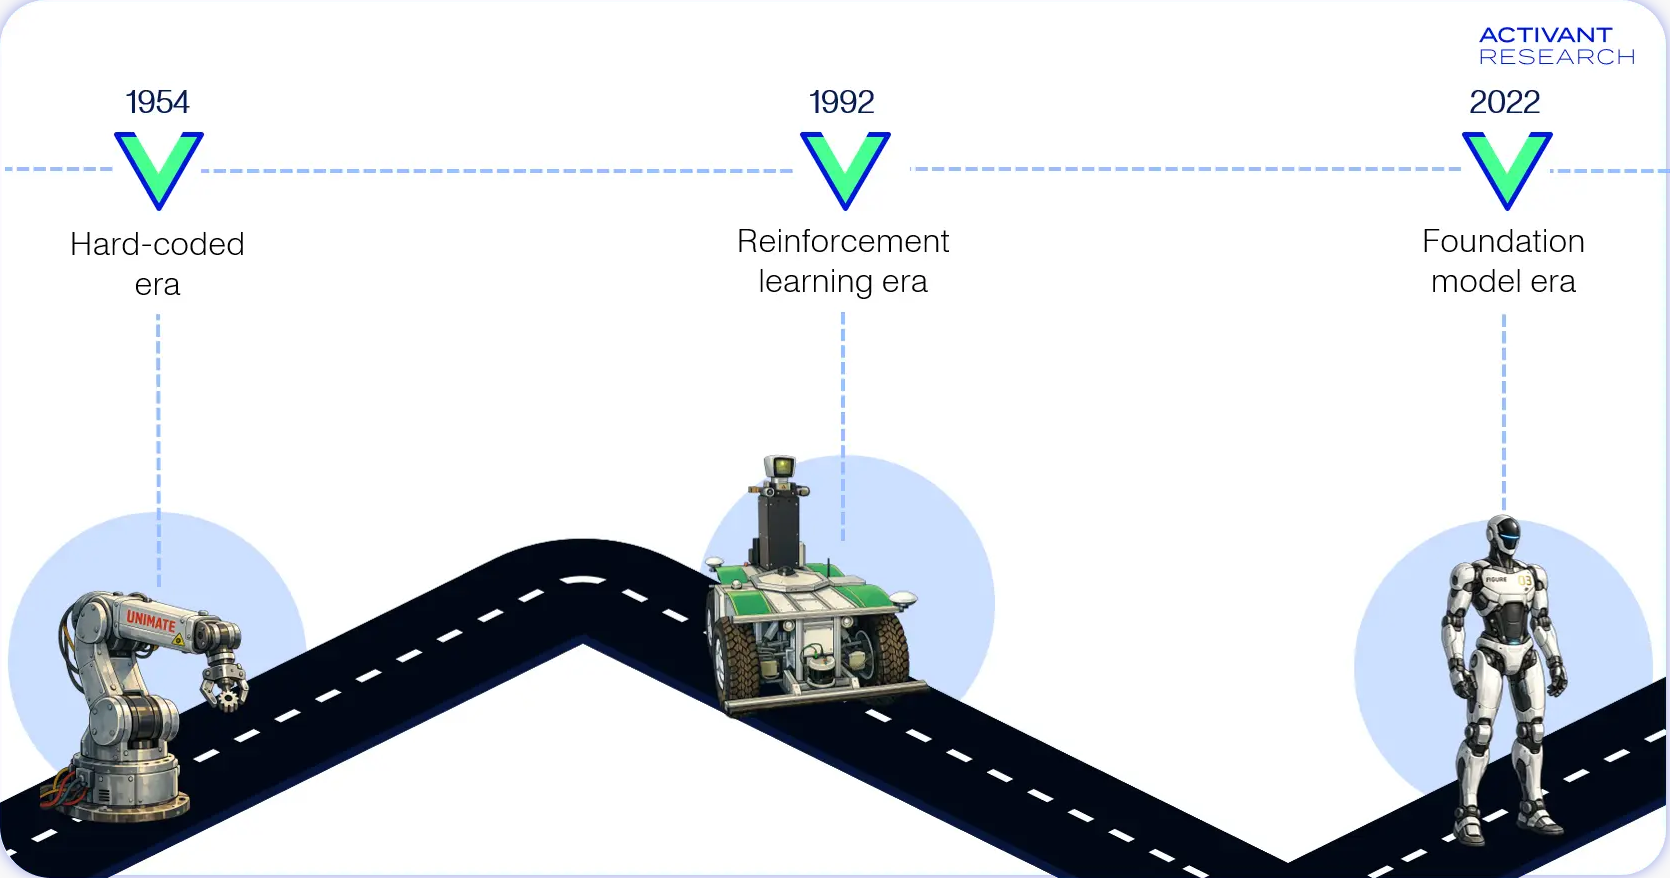
Historically, robots were confined to industrial settings where tasks have low complexity and high repeatability. The hard-coded industrial robots of the mid-late 20th century revolutionized production lines by automating highly repetitive (and sometimes dangerous) motions. In the 1990s, reinforcement learning techniques gave robots a slightly higher degree of autonomy, but tasks were still highly specific and heavily constrained to the environments that the robots were developed in. Robots are now breaking away from single-environment, single-task use cases. Recent breakthroughs have led to the development of robotic foundation models which are task-, environment-, and hardware-agnostic.3334
We are finally entering the age of general-purpose robotics that once only existed in sci-fi movies. Collaborative robots (cobots) are fuelling industrial robotics, mobile robots are transforming logistics, and humanoids are bringing autonomy to human spaces.
Robotics represents the decoupling of productivity from fragile human systems through the automation of physical work. Healthcare represents the sector where that decoupling becomes economically imperative, as rising care needs converge with labor shortages to outpace the capacity of traditional delivery models.
E. Healthcare Innovation
Aging populations, labor shortages, and rising care needs are driving a sustained increase in healthcare spending, reshaping priorities across the entire system. The median annual healthcare cost for a family of four in the U.S. rose from ~$12,000 in 2005 to ~$35,000 today.35 That’s a 188% increase. To put this in context, the average U.S. wage only grew 84% over the same period.
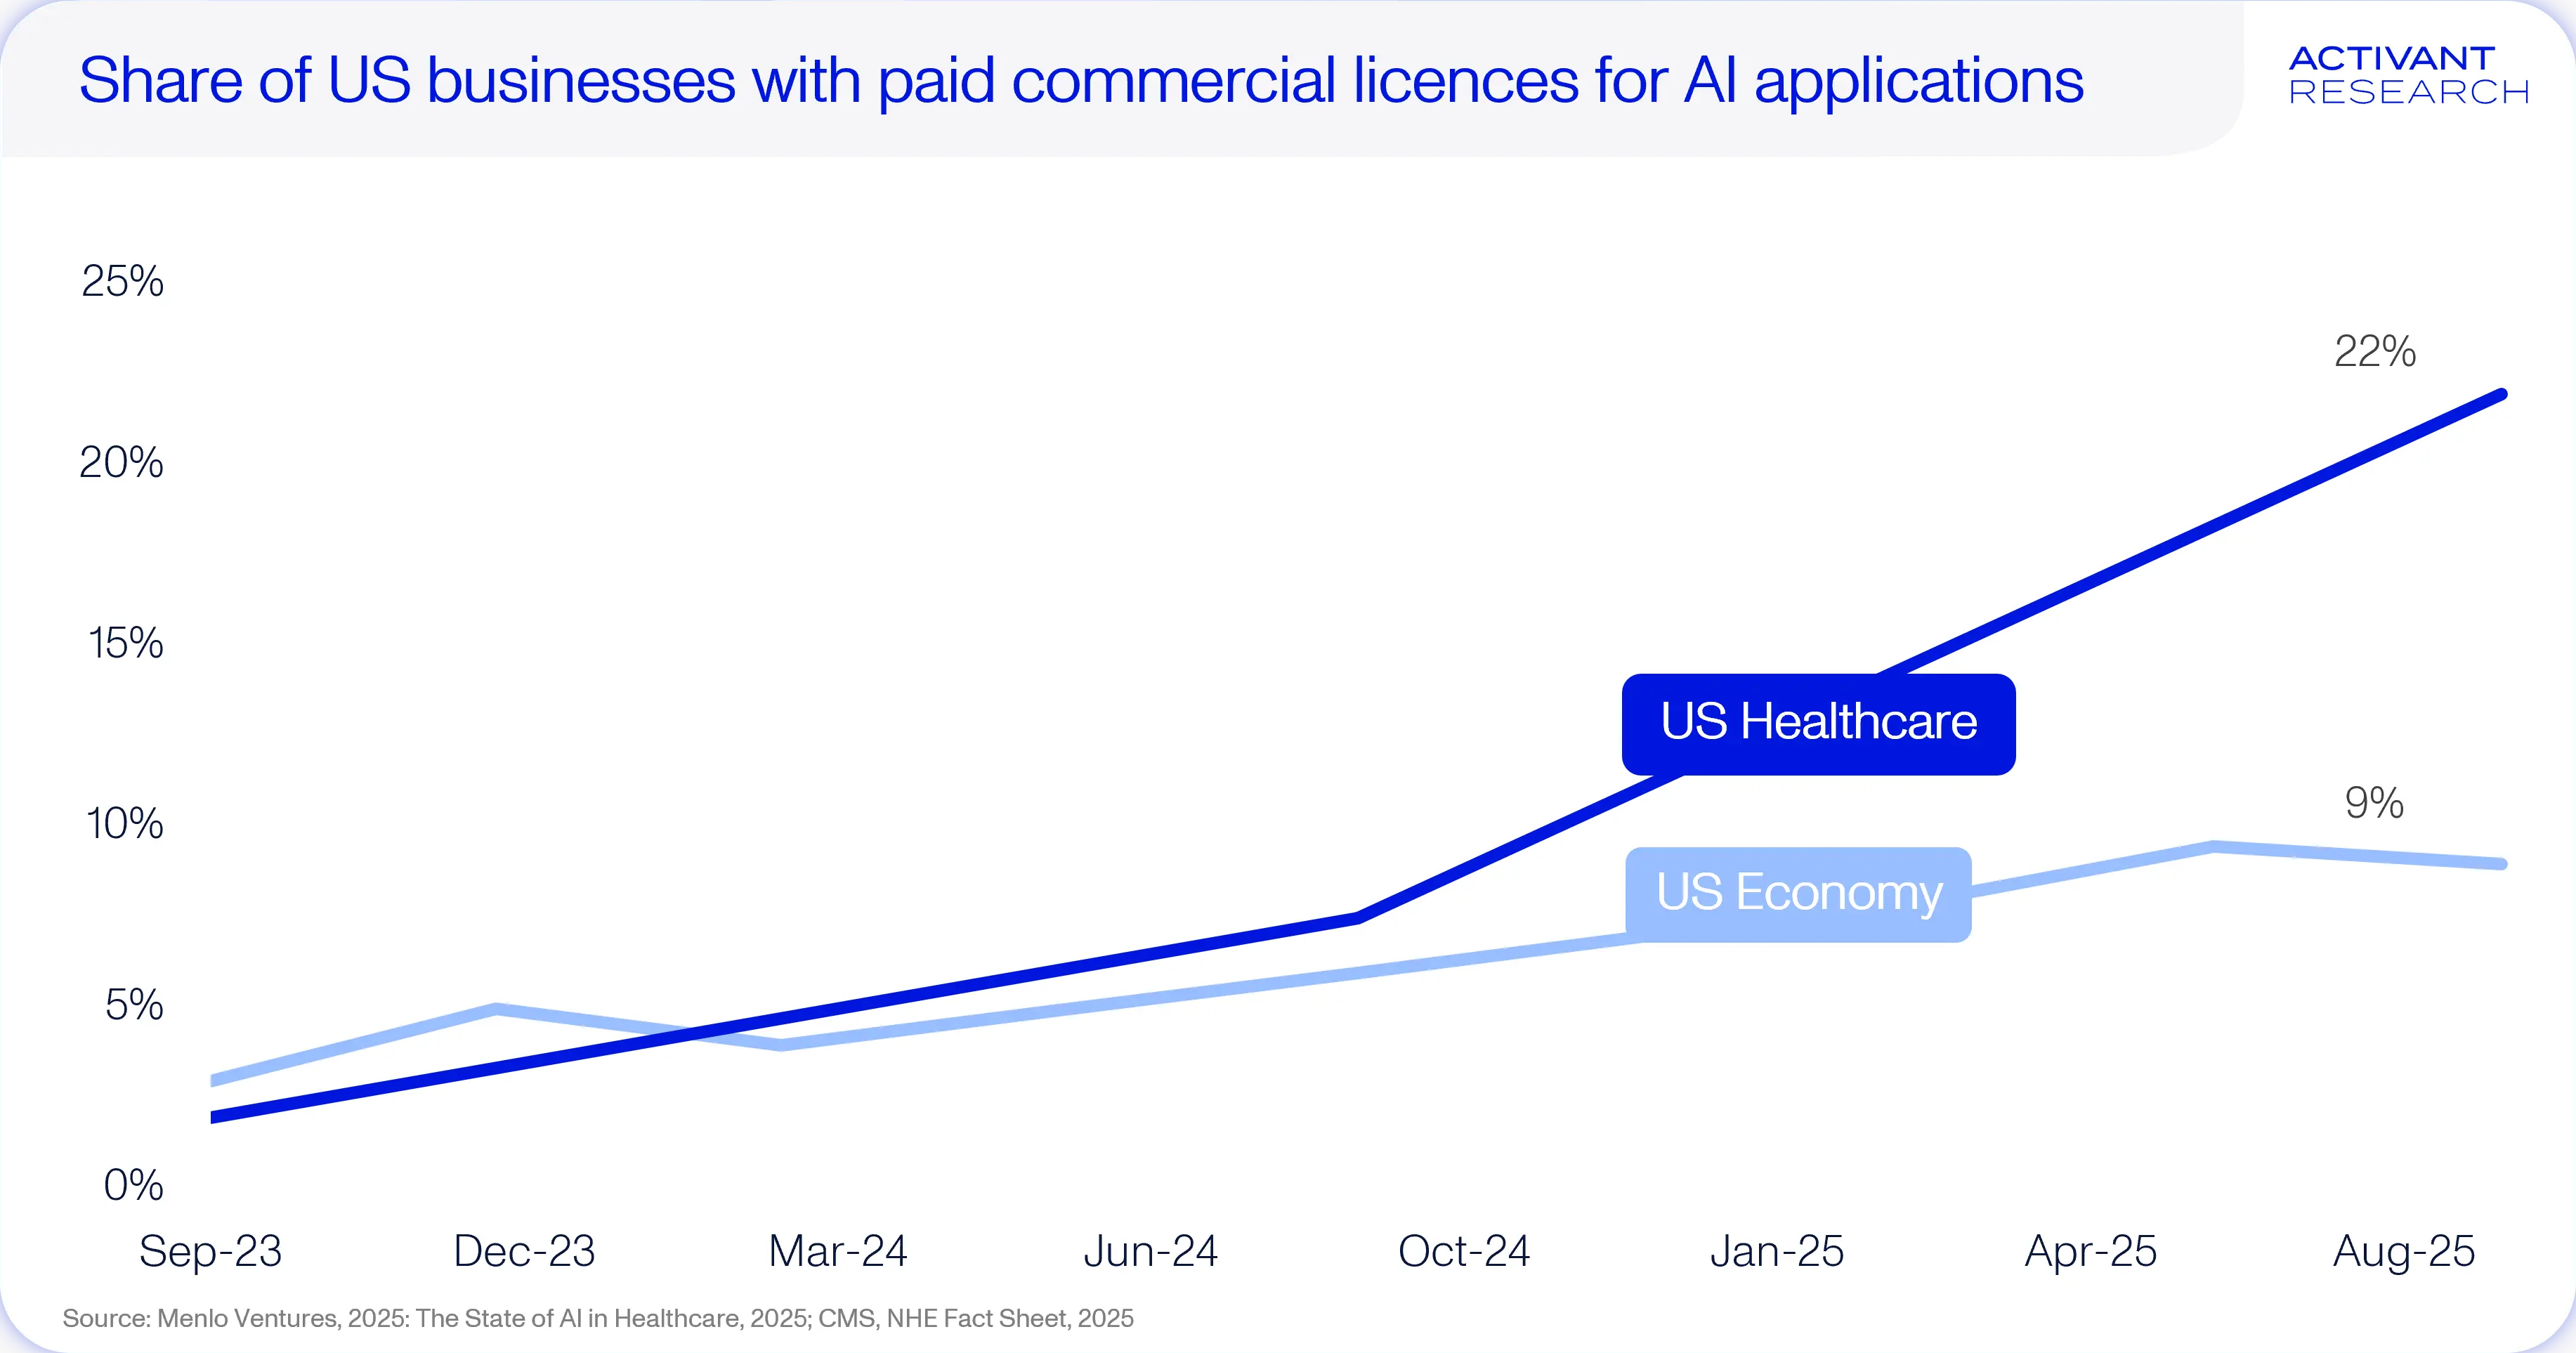
The healthcare industry makes up around 20% (or $5.6 trillion) of the U.S. economy.36 Until now, the sector has remained heavily under-digitized, representing only about 12% of enterprise software expenditure.37 This is changing. Rising costs make productivity essential. Healthcare is now the enterprise AI pace setter, with 22% of U.S. healthcare businesses paying for commercial AI licenses.
Private markets are reflecting this shift. In 2025, the U.S. healthcare AI spend reached $1.4 billion, with startups capturing 85% of that total. AI-native companies accounted for around 55% of the total HealthTech funding, leading to the emergence of eight new healthcare AI unicorns in 2025.38 AI is proving to be transformative across the wider healthcare sector, driving innovations in several key areas:
- Drug discovery: Clinical trials are traditionally expensive and lengthy processes. AI is being used across every stage of the clinical trial process to materially reduce costs and improve time-to-market for new treatments.39
- Precision medicine: The cost of sequencing a human genome dropped from almost $100 million in 2001 to below $100 in 2025, a persistent cost reduction that has remained well below Moore’s Law.40 Precision medicines like cell/gene therapy at scale are now a reality.
Chronic disease therapies are expanding beyond their initial indications to serve high-prevalence conditions with far larger addressable markets. GLP-1s are the clearest proof point. U.S. sales of the drug class (initially intended to treat type II diabetes) grew over 500% from 2018 to 2023 and is expected to accelerate even further with the release of oral obesity drug treatments in 2026.41
The healthcare sector is a perfect example of what is possible when technology is used to drive innovation at scale.
The Constraint-Era Playbook
For much of the last three decades, markets were optimized for global efficiency: abundant labor, low inflation, cheap capital, and frictionless supply chains. Today, the global economy is entering a structurally different regime, where fragmentation, volatility and scarcity are no longer episodic disruptions. In 2026 and beyond, resilience will outperform marginal efficiency; sovereignty will outweigh dependency; durability will matter more than speed; and infrastructure will sit at the center of value creation.
For investors and founders alike, this demands a new perspective. In a constraint-defined world, durable compounding is not driven by expansion alone, but by structural positioning. We are betting on four differentiators that, we believe, will separate the winners from the losers:
- Resilience as a product
- Intelligence as the edge
- Constraint as the moat
- Mission criticality as the distribution strategy
In the constraint era, AI and automation are becoming the only scalable mechanisms capable of sustaining output, security and continuity. The next compounding advantage will belong to platforms that convert volatility into operational leverage.
Resilience is the premium. Intelligence is the engine. We believe the most enduring returns will come from backing the systems that connect them.
Footnotes
-
Vox EU, A New Measure for Geopolitical Fragmentation, 2025 ↩
-
McKinsey Health Institute, Heartbeat of health: Reimagining the healthcare workforce of the future, 2025 ↩
-
Federal Reserve, Survey of Consumer Finances and Financial Accounts of the United States, 2025 ↩
-
Goldman Sachs, Generative AI could raise global GDP by 7%, 2023 ↩
-
McKinsey, The state of AI in 2025: Agents, innovation, and transformation, 2025 ↩
-
Gartner, Gartner Predicts 40% of Enterprise Apps Will Feature Task-Specific AI Agents by 2026, Up from Less Than 5% in 2025, 2025 ↩
-
McKinsey, The next big shifts in AI workloads and hyperscaler strategies, 2025 ↩
-
Camus, Why Does It Take So Long to Connect a Data Center to the Grid?, 2025 ↩
-
TrendForce, China and US Bolster Semiconductor Independence as Taiwan’s Foundry Capacity Share Projected to Decline to 41% by 2027, Says TrendForce, 2023 ↩
-
S McGregor, Preventing Repeated Real World AI Failures by Cataloging Incidents: The AI Incident Database, 2025 ↩
-
Activant analysis of public disclosures on reputable news and media sites; list includes 68 AI companies founded from 1 Jan 2019 onwards, plus OpenAI (founded 2015) ↩
-
Pitchbook Analysis ↩
-
S&P CapIQ ↩
-
Ibid ↩
-
IEA, Renewables 2025, 2025 ↩
-
IRENA, Battery Energy Storage Systems: Key to Renewable Power Supply-Demand Gaps, 2025 ↩
-
NREL Technical Report, High-Penetration PV Integration Handbook for Distribution Engineers, 2016 ↩
-
U.S. Department of Energy, 2023 DOE Critical Materials Assessment, 2023 ↩
-
IDTechX: Global Trends in Critical Material Recovery: 2025 and Beyond, 2025 ↩
-
World Economic Forum, Bridging the €6.5 Trillion Water Infrastructure Gap: A Playbook, 2025 ↩
-
Google Research, Do As I Can, Not As I Say: Grounding Language in Robotic Affordances, 2022 ↩
-
Meta, V-JEPA 2: Self-Supervised Video Models Enable Understanding, Prediction and Planning, 2025 ↩
-
Centers for Medicare & Medicaid Services (CMS), National health expenditure data, NHE Fact Sheet, D2023 ↩
-
Ibid ↩
-
Applied Clinical Trials, AI in Action: Breaking Down Clinical Trial Bottlenecks, 2025 ↩
-
Frontline Genomics, The $100 Genome: Where’s the Limit, 2025 ↩
-
JAMA Network, Spending on Glucagon-Like Peptide-1 Receptor Agonists Among US Adults, 2025 ↩
Disclaimer: The information contained herein is provided for informational purposes only and should not be construed as investment advice. The opinions, views, forecasts, performance, estimates, etc. expressed herein are subject to change without notice. Certain statements contained herein reflect the subjective views and opinions of Activant. Past performance is not indicative of future results. No representation is made that any investment will or is likely to achieve its objectives. All investments involve risk and may result in loss. This newsletter does not constitute an offer to sell or a solicitation of an offer to buy any security. Activant does not provide tax or legal advice and you are encouraged to seek the advice of a tax or legal professional regarding your individual circumstances.
This content may not under any circumstances be relied upon when making a decision to invest in any fund or investment, including those managed by Activant. Certain information contained in here has been obtained from third-party sources, including from portfolio companies of funds managed by Activant. While taken from sources believed to be reliable, Activant has not independently verified such information and makes no representations about the current or enduring accuracy of the information or its appropriateness for a given situation.
Activant does not solicit or make its services available to the public. The content provided herein may include information regarding past and/or present portfolio companies or investments managed by Activant, its affiliates and/or personnel. References to specific companies are for illustrative purposes only and do not necessarily reflect Activant investments. It should not be assumed that investments made in the future will have similar characteristics. Please see "full list of investments" at activantcapital.com/companies/ for a full list of investments. Any portfolio companies discussed herein should not be assumed to have been profitable. Certain information herein constitutes "forward-looking statements." All forward-looking statements represent only the intent and belief of Activant as of the date such statements were made. None of Activant or any of its affiliates (i) assumes any responsibility for the accuracy and completeness of any forward-looking statements or (ii) undertakes any obligation to disseminate any updates or revisions to any forward-looking statement contained herein to reflect any change in their expectation with regard thereto or any change in events, conditions or circumstances on which any such statement is based. Due to various risks and uncertainties, actual events or results may differ materially from those reflected or contemplated in such forward-looking statements.